HRV4Training Pro: user guide
available now at HRV4Training.web.app
In the past few months, I’ve been busy building the new version of HRV4Training Pro, an improved web platform for individuals and teams aiming at better understanding how different stressors affect their resting physiology so that adjustments towards better health and performance can potentially be made.
In this post, I will add links to other blogs where each individual page or feature will be covered, so that this document can be referenced as a user guide.
For an overview of the principles behind HRV4Training Pro, check out this blog.
This guide is structured as follows:
Pro users: main features and functionalities of HRV4Training Pro for individuals.
Teams: coach panel and additional features built for teams.
App: the HRV4Training app will also change when you have a Pro account, showing the normal range under Baseline, and rMSSD in the homepage (if you select it from Settings).
HRV4Training Pro is compatible with client apps on both iPhone and Android and requires an HRV4Training account as well as a subscription that can be purchased from the web platform. You can get a 1-month free trial simply by logging in with your HRV4Training credentials, here (subscription for the current Pro will automatically migrate to the new one).
HRV4Training Pro is a responsive web platform, meaning that it looks good and scales well on all resolutions, including smaller phones. This way you can use it on the move too.
Pro Users
In this section, we look in more detail at most features and functionalities available in HRV4Training Pro:
Overview
HRV4Training Pro features an overview page that aims at easing the interpretation of HRV data for your own analysis as well as your team data. The page shows the normal range, daily and weekly averages for HRV and heart rate data. You can optionally highlight each recording with different annotations, and add training load and subjective parameters as context in additional plots. Correlations are reported for the selected parameters.
Dashboard
The dashboard provides you with a simple but effective tool to analyze trends and changes in multiple parameters at the same time, the radar plot. In particular, you can pick between 3 and 6 parameters, including resting physiology and subjective data, and the system will analyze how your data is trending in the current week, with respect to the prior month. This way, you can easily track progress or relative changes.
You can also see how this combination of parameters has evolved over time, in relation to their normal range. This way, you can build your own combined score to track changes in physiology and subjective metrics:
Calendar
The calendar page, as the name implies, is a calendar view of your historical data, so that you can easily browse through your data and look at a number of parameters: physiology, subjective data, and training information. You can change the size and color of each individual day based on the parameters you log (e.g. below the size is dependent on the distance, while the color on the intensity), so that you can quickly explore and make sense of the data.
Resting physiology
The resting physiology page provides an overview of your HRV, heart rate, and coefficient of variation, together with daily and baseline changes and their respective normal ranges. The individual parameters are then combined in HRV4Training’s trend detection, to determine if a recent trend is changing in a trivial way, or if the change is something to take more seriously, based on historical data. Combining these physiological parameters, the platform will also estimate your current response, among one of the following: stable, coping well with training, maladaptation, or risk of accumulated fatigue (more details, here). The trend detection in Pro will also assess the possibility of parasympathetic saturation, which I discuss here.
Training Intensity Distribution
The training intensity distribution analysis allows you to get an overview of how you are training in terms of intensity, e.g. how much of your training is spent at low intensities, a typical pattern seen for endurance athletes (both for polarized and pyramidal distributions).
Lactate Threshold (Critical Pace) and Race Time Estimation
The lactate threshold and race time estimation feature allow runners using the Strava or TrainingPeaks integration and training with a heart rate monitor, to determine their lactate threshold (in this context, we could call it critical pace), and estimated times over the half and full marathon distance. The estimate is then used to provide advice on pacing strategies for racing and workouts. Check out this publication to learn more about our work on predicting running performance and building this model.
All estimates require no specific tests and are based on models combining resting physiology, workouts data, and training patterns. We recommend using Strava for this feature to work best, as we can access more detailed workout information in that case (e.g. laps instead of just workout summaries).
VO2max Estimation
The VO2max estimation page is for runners and cyclists using the Strava or TrainingPeaks integration and training with a heart rate monitor (and power meter in case of cyclists). HRV4Training can estimate cardiorespiratory fitness level (VO2max) based on the relationship between internal (heart rate) and external (pace or power) load. Check out this post for more details and our publication showing a strong agreement between real-life running performance and estimated VO2max.
Correlation Analysis
The correlations page lets you explore the relationship between physiological variables (e.g. HR and HRV) and your annotated Tags. Looking at correlations can help us to pinpoint which parameters have a stronger impact on our physiology, and potentially make adjustments (e.g. if there is a strong negative correlation between work stress and HRV, maybe we should try to reduce work stress). Keep in mind that these are just correlations, and don't imply a causal relationship. Other variables might be key in explaining the correlations you are seeing (or not seeing) on this page.
We will compute weekly moving averages from your daily measurements to analyze not only day-to-day correlations but also baseline changes.
Intervals Analysis
As runners or cyclists, there are a few workouts that we might tend to do over and over again during different phases of our training plan, which help develop certain skills (e.g. neuromuscular fitness and speed as well as VO2max). Countless times we had to go back and forth in our log to see how much progress we had made, browsing months of data and trying to do the math on our average splits and recoveries. To make the process easier, we built the Intervals Analysis feature in HRV4Training Pro, which analyzes your intervals and progress automatically. (note that you need to use Strava for this feature to work).
Aerobic Endurance Analysis
The aerobic endurance analysis includes two features: aerobic efficiency and cardiac decoupling. In both cases, aerobic endurance relates to your ability to sustain a given workload. To determine your aerobic endurance we compute the ratio between external load or output (pace or power) and internal load or input (heart rate) across workouts (efficiency) and within a workout (decoupling). Intuitively, a lower heart rate for the same output (pace or power), when consistently shown over periods of weeks, translates into better aerobic endurance.
Training Load Analysis
In the training load analysis, you can first pick the metric most representative of your training. This can be RPE, TSS, Relative Effort, training distance or time, etc. - depending on your sport and the way you train. For running, I often use simply distance or time. Once you have picked a metric, you can analyze fitness and fatigue, determined as chronic and acute training loads, as well as readiness to perform and injury risk.
Teams
HRV4Training Pro provides all functionalities above, plus a few extra, for coaches that wish to use the platform with their athletes, as well as teams. In particular, you will be able to:
Receive and synch your athletes' data right after they've taken the morning HRV measurement, from iPhone and Android clients., so that you can analyze their data remotely.
Monitor daily values and deviations from your athlete's baseline and receive daily advice to make meaningful adjustments to training programs. The athletes’ list provides an overview of the daily advice, daily HRV, and subjective metrics so that you can get an overview of your entire team and take action without having to go through all the data for each individual athlete.
Group and filter athletes.
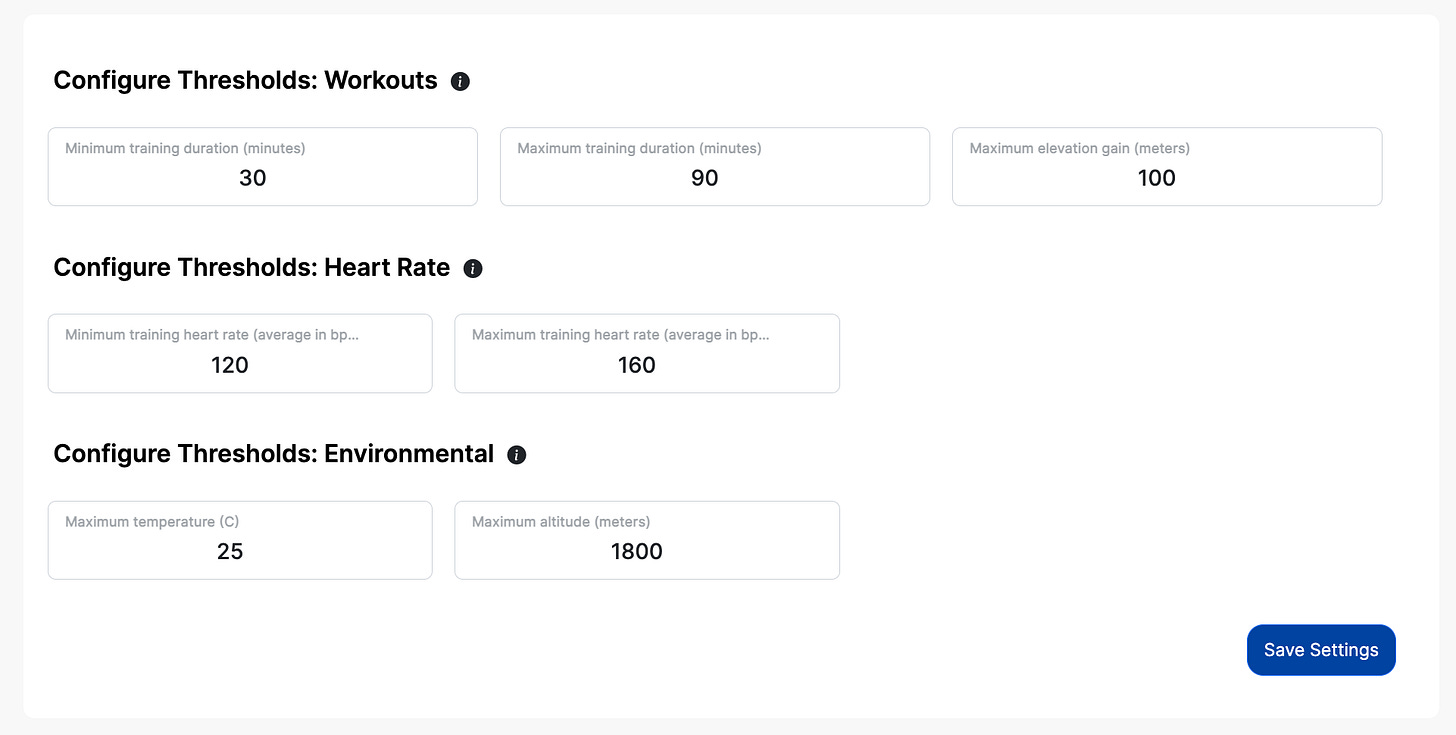
Remotely configure all tags your athletes should be using, optionally hiding the daily advice.
Export all data as csv files
Customer support
Check out this blog for details on the Coach Panel.
For an overview of the use of HRV in team sports, check out this blog post.
App
rMSSD on the app homepage
With Pro, you can swipe the homepage and see your daily HRV, baseline, and normal range in terms of rMSSD (normally, what we call HRV is a logarithmic transformation of this value)
The swiping between views will be enabled if you select rMSSD under HRV View in Settings
Normal range and detected trend in the Baseline page
With Pro, the Baseline page will show visually your normal range, and also let you color-code the data based on different parameters:
detected long-term trend
sickness
alcohol intake
menstrual cycle
daily advice
travel
This way it will be easier to keep an eye on the bigger picture and contextualize your measurement based on annotations and analytics.
Try HRV4Training Pro here.
I hope you’ll find the platform useful to better contextualize and interpret physiological changes in the long term.
Pro subscriptions allow us to keep building HRV4Training and maintain this small business independent.
We thank you for your support and would like to offer you an extra discount: please use code SCIENCE for 20% off.
Marco holds a PhD cum laude in applied machine learning, a M.Sc. cum laude in computer science engineering, and a M.Sc. cum laude in human movement sciences and high-performance coaching.
He has published more than 50 papers and patents at the intersection between physiology, health, technology, and human performance.
He is co-founder of HRV4Training, advisor at Oura, guest lecturer at VU Amsterdam, and editor for IEEE Pervasive Computing Magazine. He loves running.
Social:


Hi Marco,
I did enter on the trial month for the pro version.
If I don’t want it I should cancel before it renews or it’ll ask me?
Thank you!
Please talk more about the FTP feature in HRVPro. I’d like to never ride another 20-minute power test. Thank you.