HRV4Training Pro: Calendar
User guide index: https://marcoaltini.substack.com/p/hrv4training-pro-user-guide
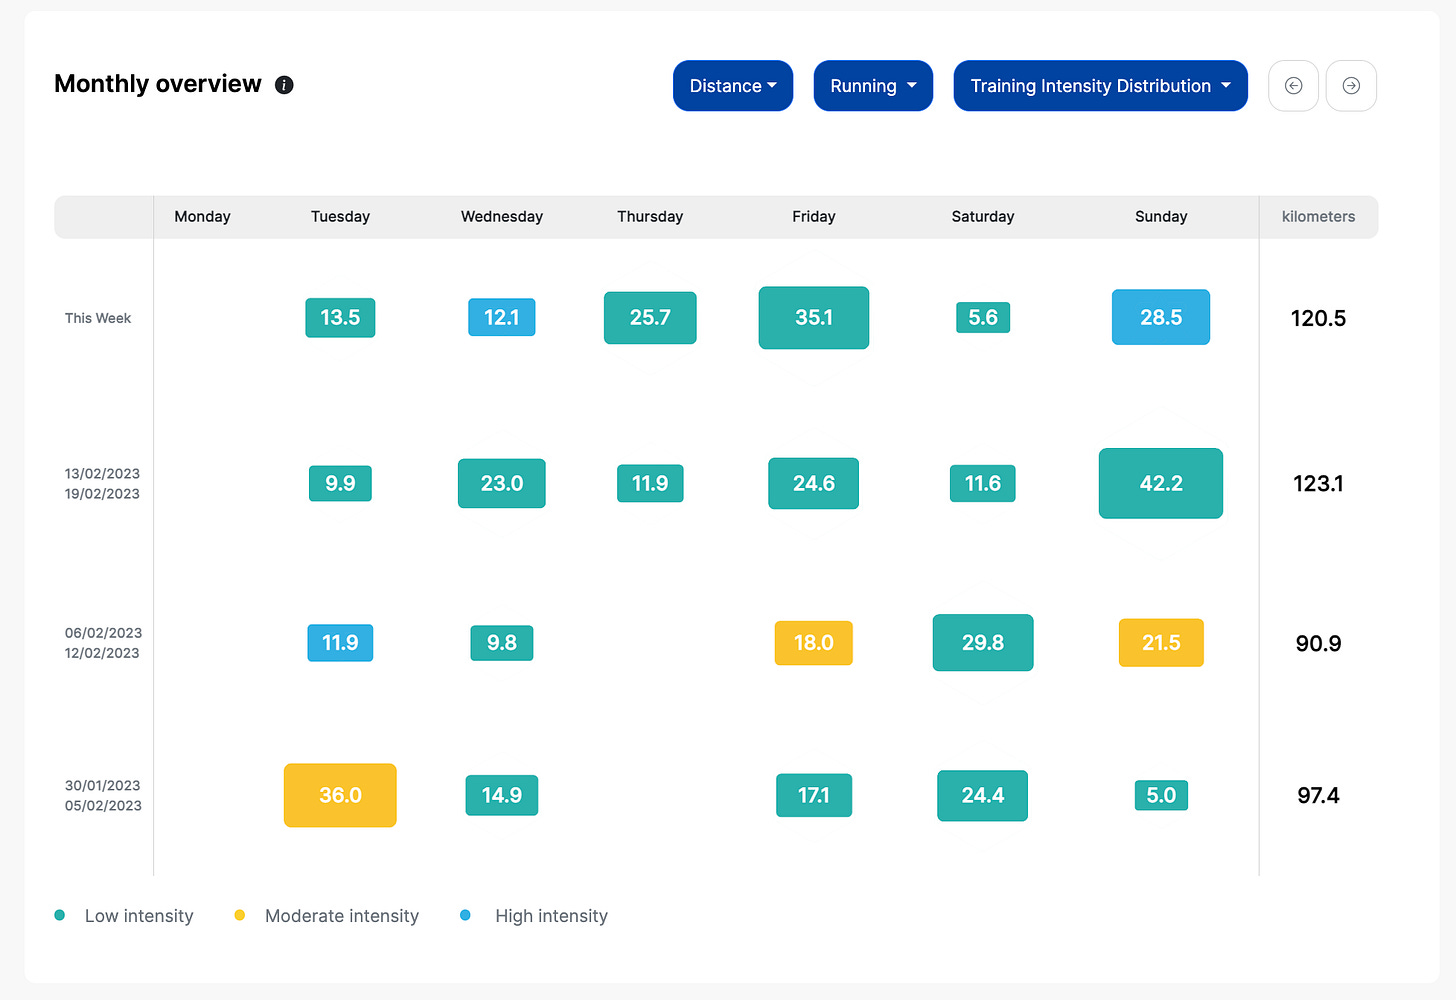
The calendar page, as the name implies, is a calendar view of your historical data, so that you can easily browse through your data and look at a number of parameters: physiology, subjective data, and training information. You can change the size and color of each individual day based on the parameters you log (e.g. below the size is dependent on the distance, while the color on the intensity), so that you can quickly explore and make sense of the data.
Below is an example of my HRV data, color-coded by the daily advice, typically showing a yellow HRV when the value is below my normal range:
We can also look at training-related data, for example, running distance color-coded by training intensity, which shows us the frequency of easy, moderate, and hard workouts, together with the total distance:
The size of each rectangle depends on the selected parameter, hence rMSSD in the first image and distance in this one.
Tapping on a day shows a summary of the HRV and subjective parameters for the day, as well as any training data that was recorded:
I hope you’ll like the new Calendar page and the improvements we implemented.
Please feel free to comment below in case of any questions or feature requests.
Thank you for your support.
Marco holds a PhD cum laude in applied machine learning, a M.Sc. cum laude in computer science engineering, and a M.Sc. cum laude in human movement sciences and high-performance coaching.
He has published more than 50 papers and patents at the intersection between physiology, health, technology, and human performance.
He is co-founder of HRV4Training, advisor at Oura, guest lecturer at VU Amsterdam, and editor for IEEE Pervasive Computing Magazine. He loves running.
Social:


Ciao, mi sono appena iscritto per il trial di un mese per il PRO. Non riesco a capire come inserire gli allenamenti :D. Ho fatto solo una prova con la lettura HRV nel pomeriggio. Grazie