Correlation Analysis
User guide index: https://marcoaltini.substack.com/p/hrv4training-pro-user-guide
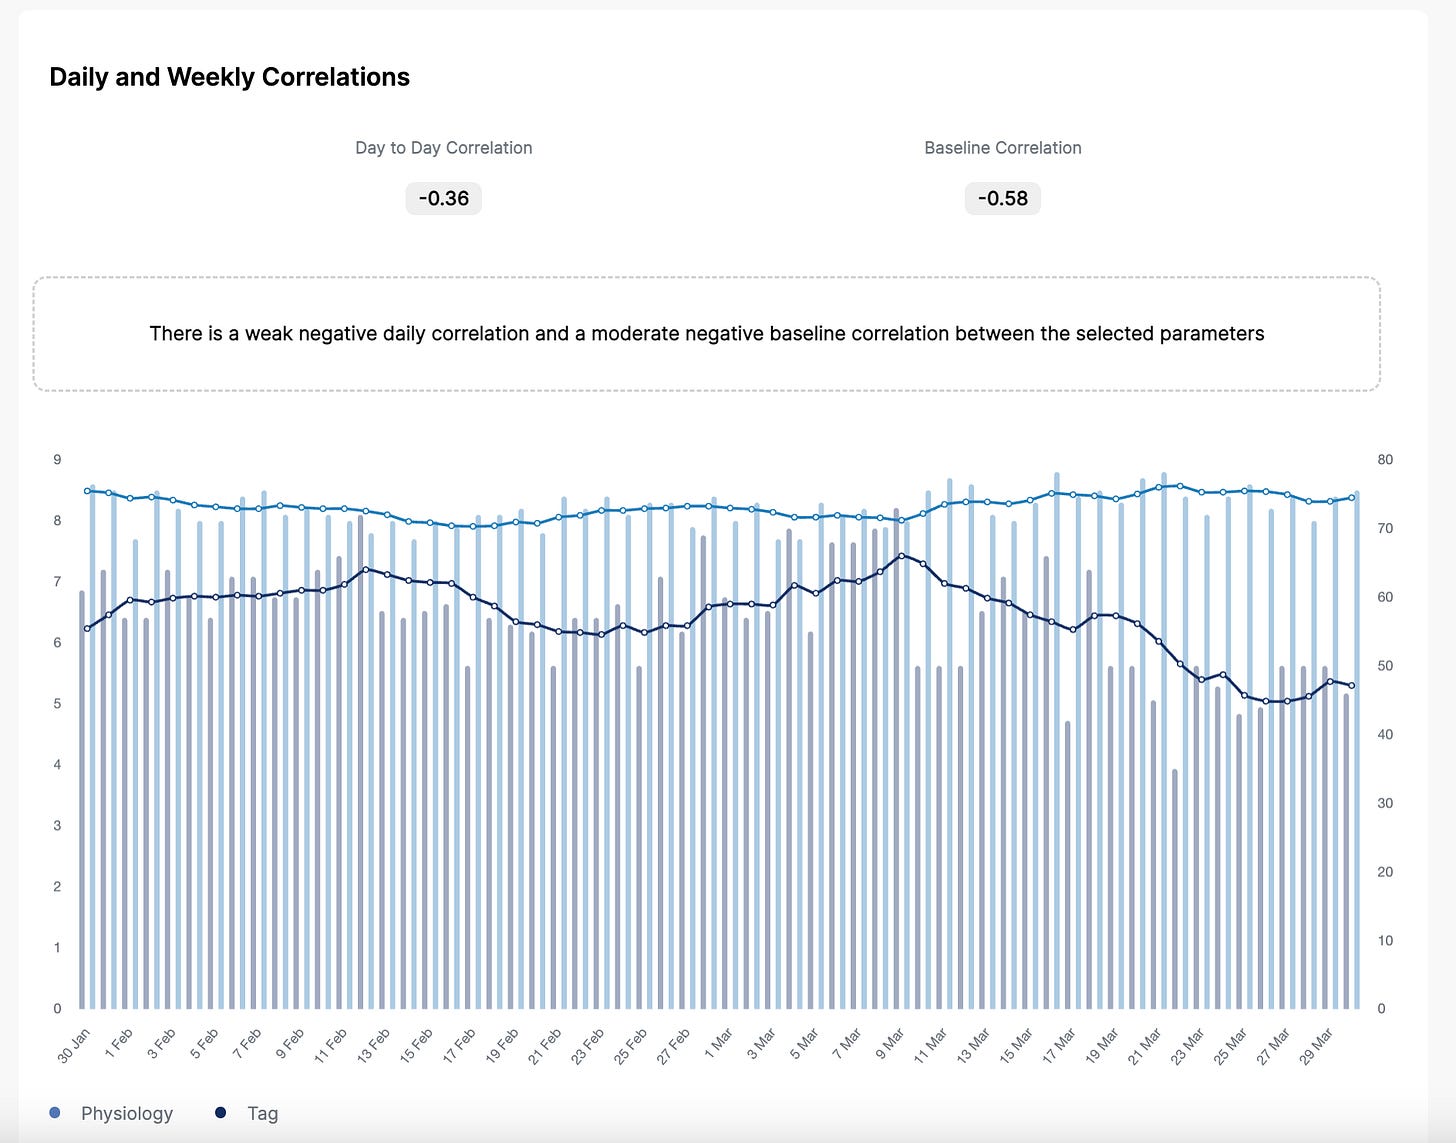
The Correlations page lets you explore the relationship between physiological variables (e.g. HR and HRV) and your annotated Tags.
Looking at correlations can help us to pinpoint which parameters have a stronger impact on our physiology, and potentially make adjustments (e.g. if there is a strong negative correlation between work stress and HRV, maybe we should try to reduce work stress). Keep in mind that these are just correlations, and don't imply a causal relationship. Other variables might be key in explaining the correlations you are seeing (or not seeing) on this page.
We will compute weekly moving averages from your daily measurements to analyze not only day-to-day correlations but also baseline changes.
How should I configure this analysis?
The correlation analysis in HRV4Training Pro lets you pick any timeframe between 30 days and 1 year. However, in general, we think that using a time frame between 60 and 90 days is ideal.
Why is that? Most likely the stressors you face will change over time, and similarly, your response to certain stressors will change, therefore we believe it can be more helpful to look at these relationships in the relatively short time frame (e.g. 60-90 days), to get a better idea of what factors are influencing your physiology the most. Shorter windows (e.g. 30 days) might not have enough data unless some really large stressor was present (for example if you go from sea level to 2000m / 6000ft of altitude, then you will certainly see a strong correlation between resting heart rate and altitude), otherwise, it might be better to extend the window. On the other hand, longer windows (e.g. a whole year) might fail to capture more complex, multidimensional relationships between various training and lifestyle aspects, and your physiology.
Finally, we would recommend looking at baseline correlations, more than day-to-day correlations. Baseline correlations are computed on the 7 days moving average of each variable and therefore provide a more stable trend of the data. Typically, this is more insightful than looking at the individual data points, especially in the longer term.
Below you can see an example:
Negative correlations are shown in yellow. Remember that negative means that for example, your HRV goes up while the other parameter goes down. It does not mean that this is a bad thing! If you have a negative relationship between life stress and HRV it simply means that your HRV goes up when your life stress goes down, as shown here in my own data.
Positive correlations are shown in blue, in this case a higher HRV is associated with a higher value for a given parameter, for example, motivation in my case
The important part after you start looking at these correlations is not to jump to conclusions. For example, it could be that the relationship you are seeing is actually caused by another variable excluded by the analysis. However, this can be a useful starting point to explore your data.
I hope you’ll like the new Correlation Analysis page and the improvements we implemented.
Please feel free to comment below in case of any questions or feature requests.
Thank you for your support.
Marco holds a PhD cum laude in applied machine learning, a M.Sc. cum laude in computer science engineering, and a M.Sc. cum laude in human movement sciences and high-performance coaching.
He has published more than 50 papers and patents at the intersection between physiology, health, technology, and human performance.
He is co-founder of HRV4Training, advisor at Oura, guest lecturer at VU Amsterdam, and editor for IEEE Pervasive Computing Magazine. He loves running.
Social:


