HRV4Training Pro: Training Intensity Distribution
User guide index: https://marcoaltini.substack.com/p/hrv4training-pro-user-guide
The training intensity distribution analysis allows you to get an overview of how you are training in terms of intensity, e.g. how much of your training is spent at low intensities, a typical pattern seen for endurance athletes (both for polarized and pyramidal distributions).
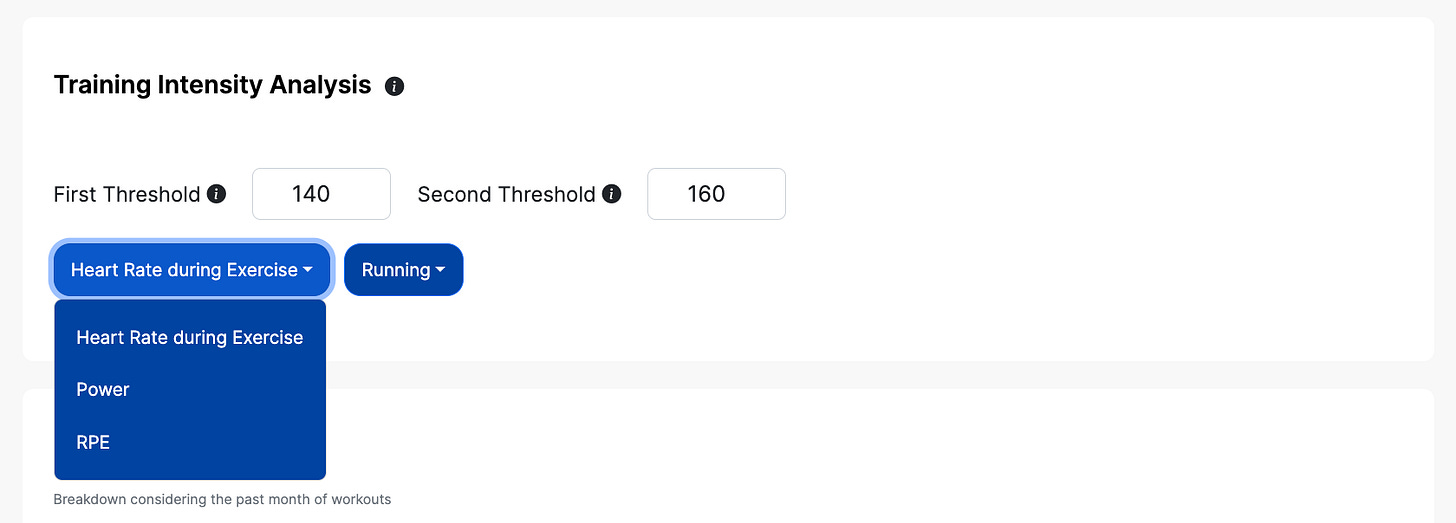
First, you can pick a parameter to be used to determine training intensity. Typically, heart rate or RPE are good choices, as they reflect internal load (i.e. the body’s response to the work done).
The first threshold is your aerobic threshold, or first lactate (or ventilatory threshold). In other terms, this threshold distinguishes easy training from all other training (moderate or hard). The second threshold is the second lactate or ventilatory threshold, and we could also consider our critical power or speed. The time spent between thresholds normally determines if the overall distribution is polarized (less time spent at moderate intensity) or pyramidal (more time spent at moderate intensity). Depending on your level and the time of the season with respect to your target event, one or either might be preferable, as I discuss here.
Once we have made our choice, the time spent at different intensities will be reported.
The analysis also provides a plot where we can look at how the distribution changes over time. For example, below we can see the distribution resulting from the following training periodization:
VO2max block, with low-intensity running, alternated to high intensity, short sessions of intervals. We can see no time at moderate intensity in the first part of the graph (December / January).
Lactate threshold / steady-state block: more time is spent at a moderate intensity as this is specific to the demands of the race (a marathon). We can see increasing time at moderate intensity until mid-February.
Racing: high intensity is present again in larger amounts, due to racing towards the end of the period shown (beginning of March).
Volume and intensity
The training intensity analysis page also includes an additional way to look at training volume and workout consistency, the two pillars of performance.
Each point is a training session, while dot size is heart rate, and dot color is workout intensity.
The idea is to capture an overview of training volume together with the frequency of higher-intensity workouts in the mid-long term.
Data used
A note on the data used for this analysis. If you use heart rate or power, we will be using the average of each workout. Hence, my recommendation would be to split your workouts between warmup, session, and cool down (3 workouts on your Strava feed). This way the breakdown will be more representative of the session’s effort.
That’s all for the training intensity distribution page. I hope you’ll find it useful.
Thank you for your support.
Marco holds a PhD cum laude in applied machine learning, a M.Sc. cum laude in computer science engineering, and a M.Sc. cum laude in human movement sciences and high-performance coaching.
He has published more than 50 papers and patents at the intersection between physiology, health, technology, and human performance.
He is co-founder of HRV4Training, advisor at Oura, guest lecturer at VU Amsterdam, and editor for IEEE Pervasive Computing Magazine. He loves running.
Social:
Twitter: @altini_marco.
Personal Substack.


bonjour Mario, comment sont définie les valeurs de seuils ? est-ce le résultat de mes séances de courses à pied ?
merci pour ton travail.
ok merci.