This is the second part of my series on heart rate variability (HRV). You can find part one here.
You measured. Now what?
Once you start collecting some data, the most important thing to remember is that you always need to interpret your HRV data with respect to your historical data, and there is no point in comparing your HRV to another person.
Your normal might be different from your friend’s normal (most likely it will be), and that means very little. This difference in what we call the average baseline HRV is most likely due to genetics and other factors hardly modifiable (at least if we consider health-conscious individuals if your lifestyle or health is not good, then you can also improve your baseline — but even in this case, the most meaningful way to use your data on a daily basis is to look at how things are changing over time).
Once we have understood that we should mostly look at relative changes over time, with respect to our historical data (our previous recordings), one of the most important points for data interpretation needs to be addressed: fluctuations between consecutive days.
Let’s look into this point in more detail.
Other useful resources:
Fluctuations between consecutive days
HRV data has an inherently high day-to-day variability. This means that there can be large fluctuations between consecutive days, differently from parameters that you might be more familiar with (for example your heart rate or your body weight).
What are the implications? To make effective use of the data, we need to be able to determine what changes are trivial, or just part of normal day-to-day fluctuations, and what changes do matter and might require more attention or simply truly represent a positive (or negative) adaptation to training and other stressors.
In other words, to make effective use of the data, we need to determine your normal range so that we can easily establish if a change in HRV is meaningful.
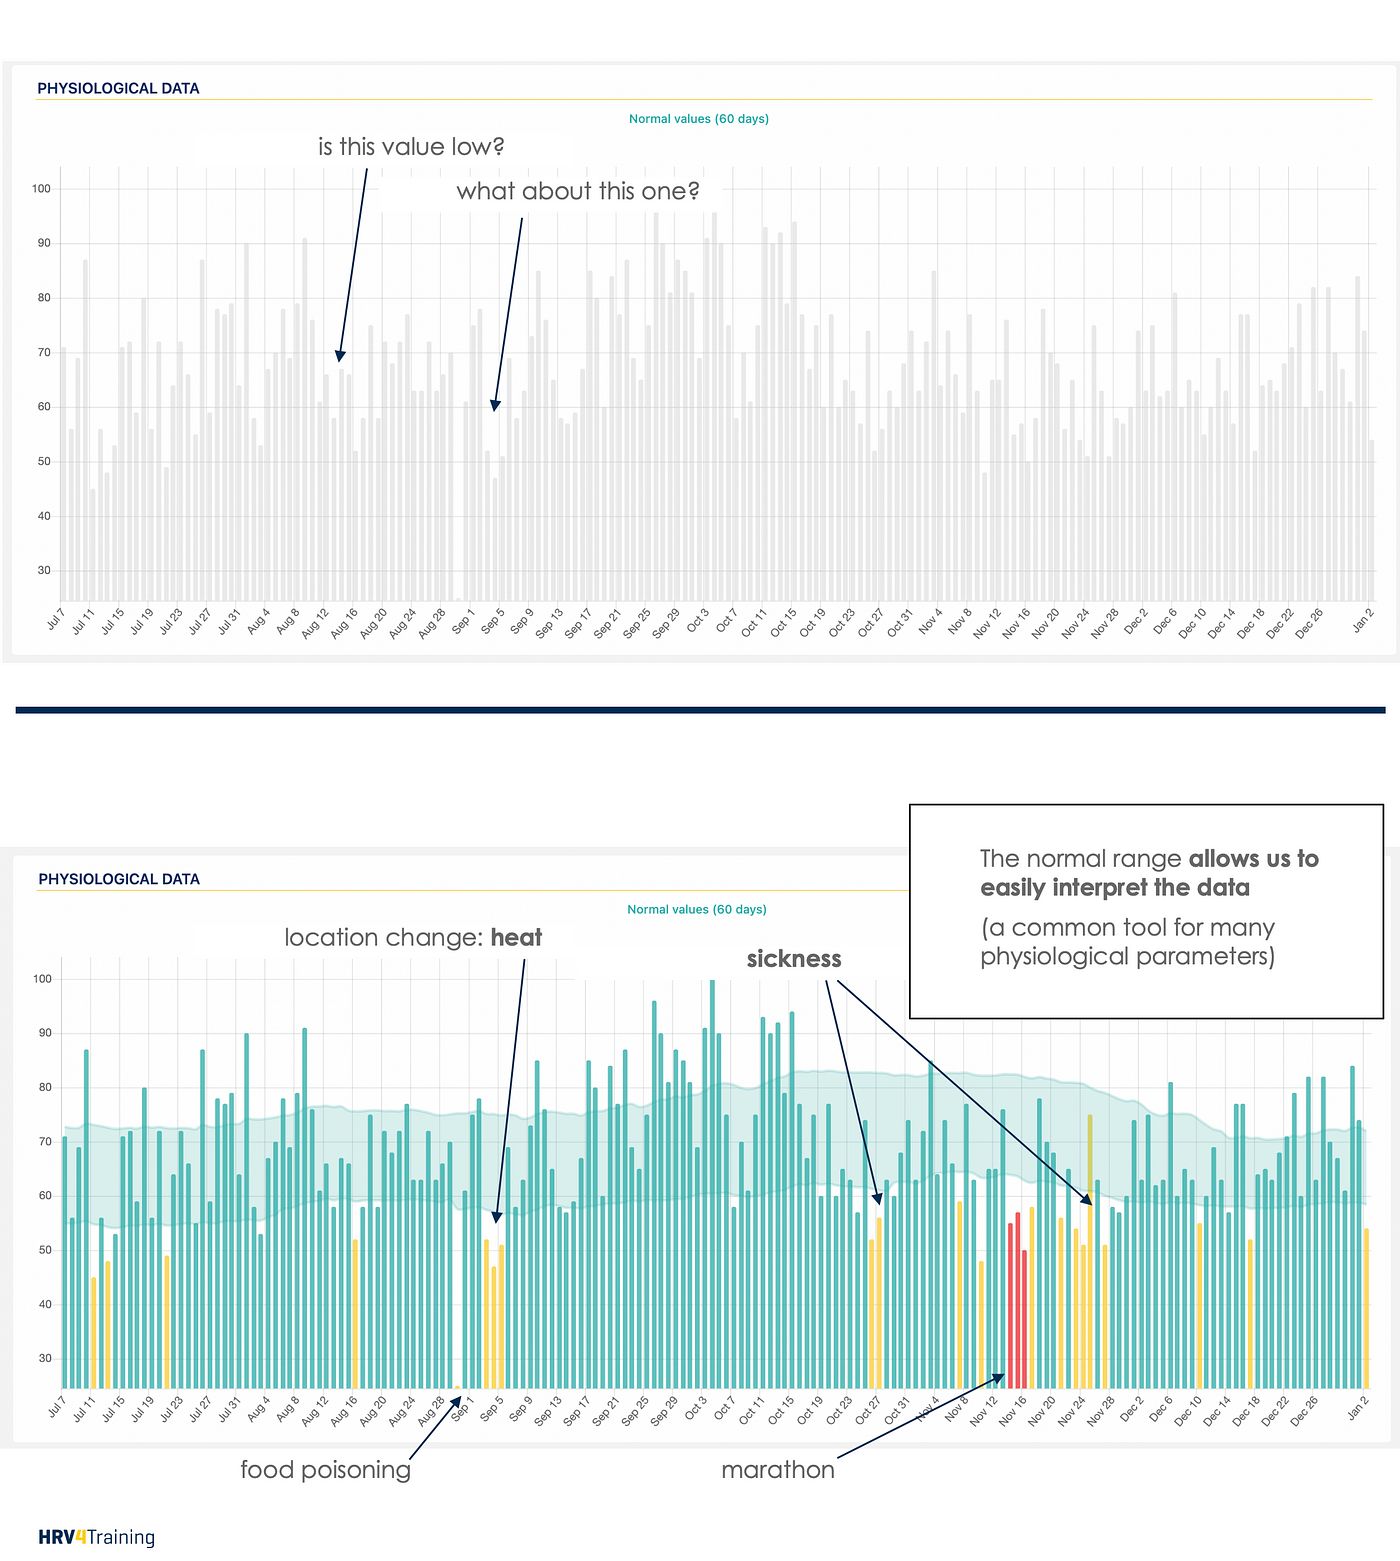
Normal is good: determining your normal range
HRV analysis requires a mindset shift. We need to shift from a “higher is better” to a “normal is better” mentality, as physiologically speaking, being in a stable condition is typically a good sign.
The inherent variability of HRV measurements is something that your app or software of choice needs to deal with. This is something we have spent a lot of time researching and designing in HRV4Training, starting with the way the daily advice is built.
A software that interprets any HRV increase as a good sign, or any HRV decrease as a bad sign, is failing to correctly represent the fact that there are normal variations in physiology and that only variations outside of this normal range, should trigger concern or more attention or simply be interpreted as actual changes.
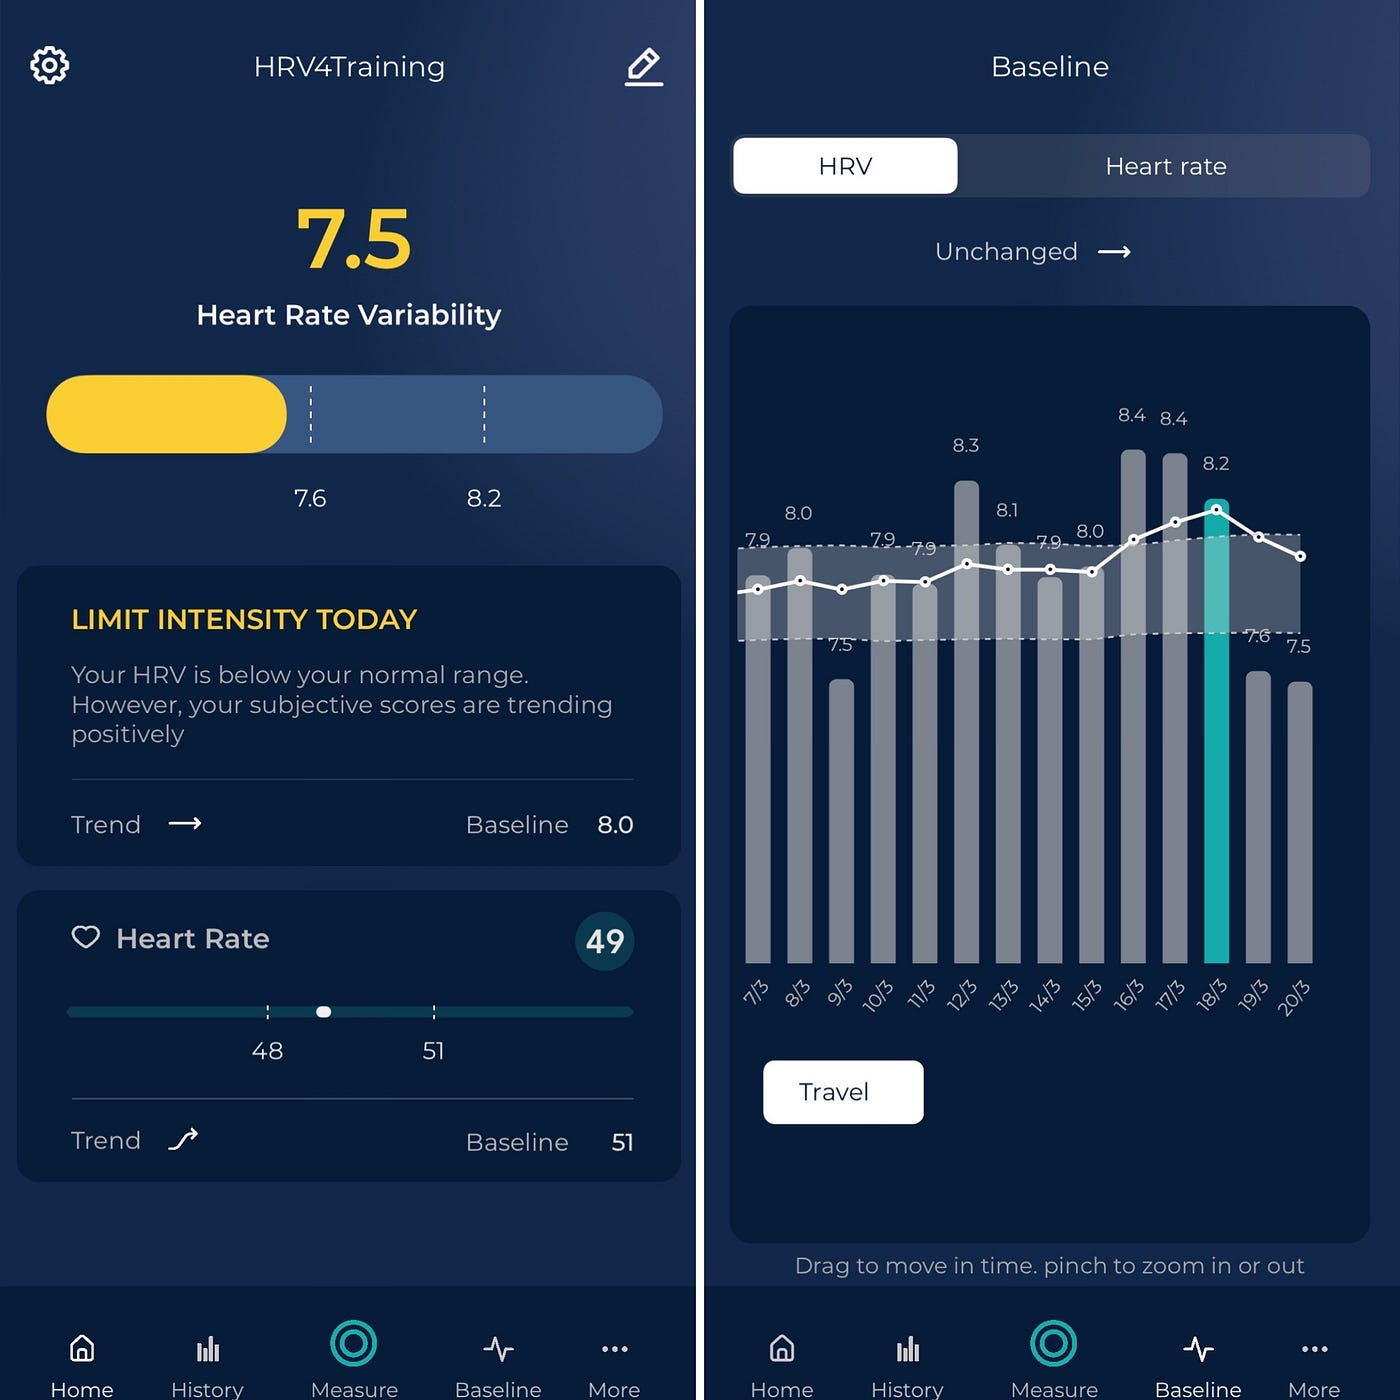
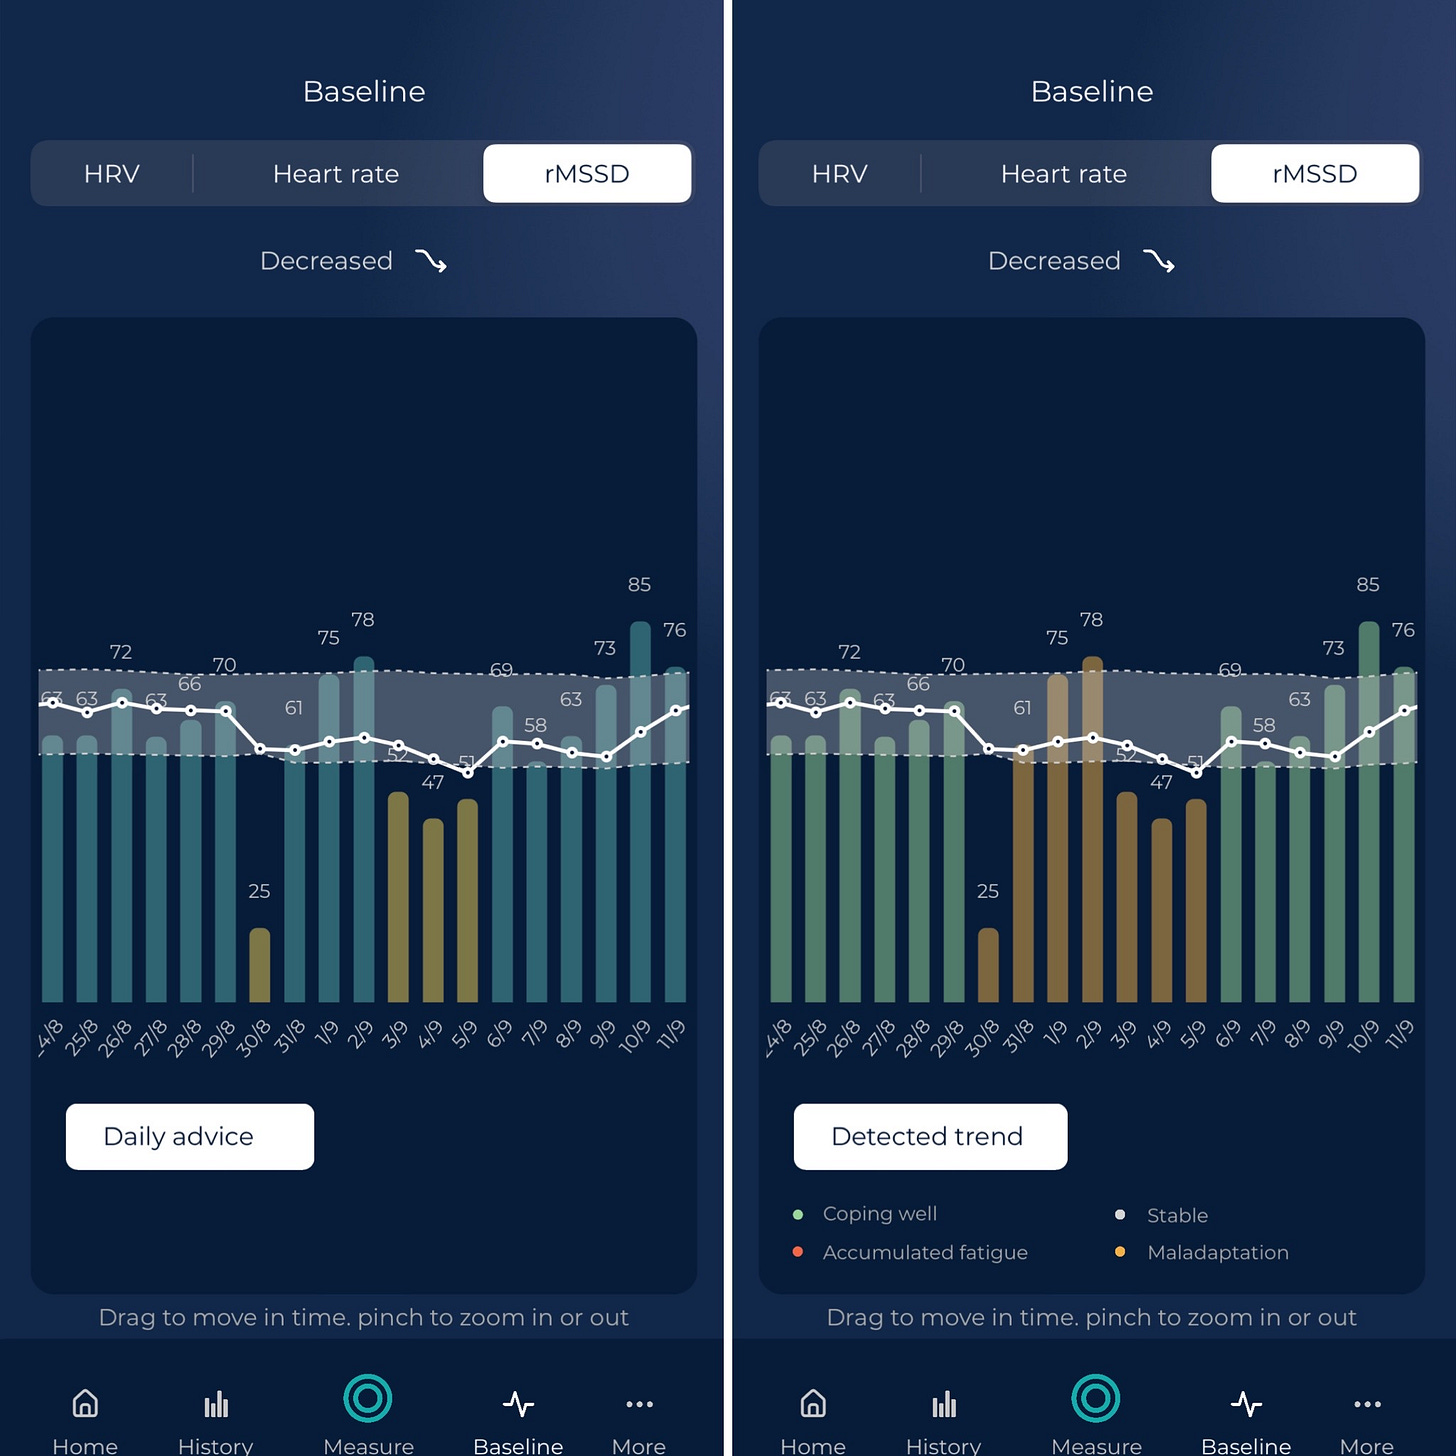
In the HRV4Training app, we report daily if your score is within your normal range, or not. Below you can see for example a day in which HRV is particularly low, highlighting more stress on the body, due to traveling. Resting heart rate is typically not as sensitive to stressors, as we will discuss below, and indeed in this case remained within its normal range
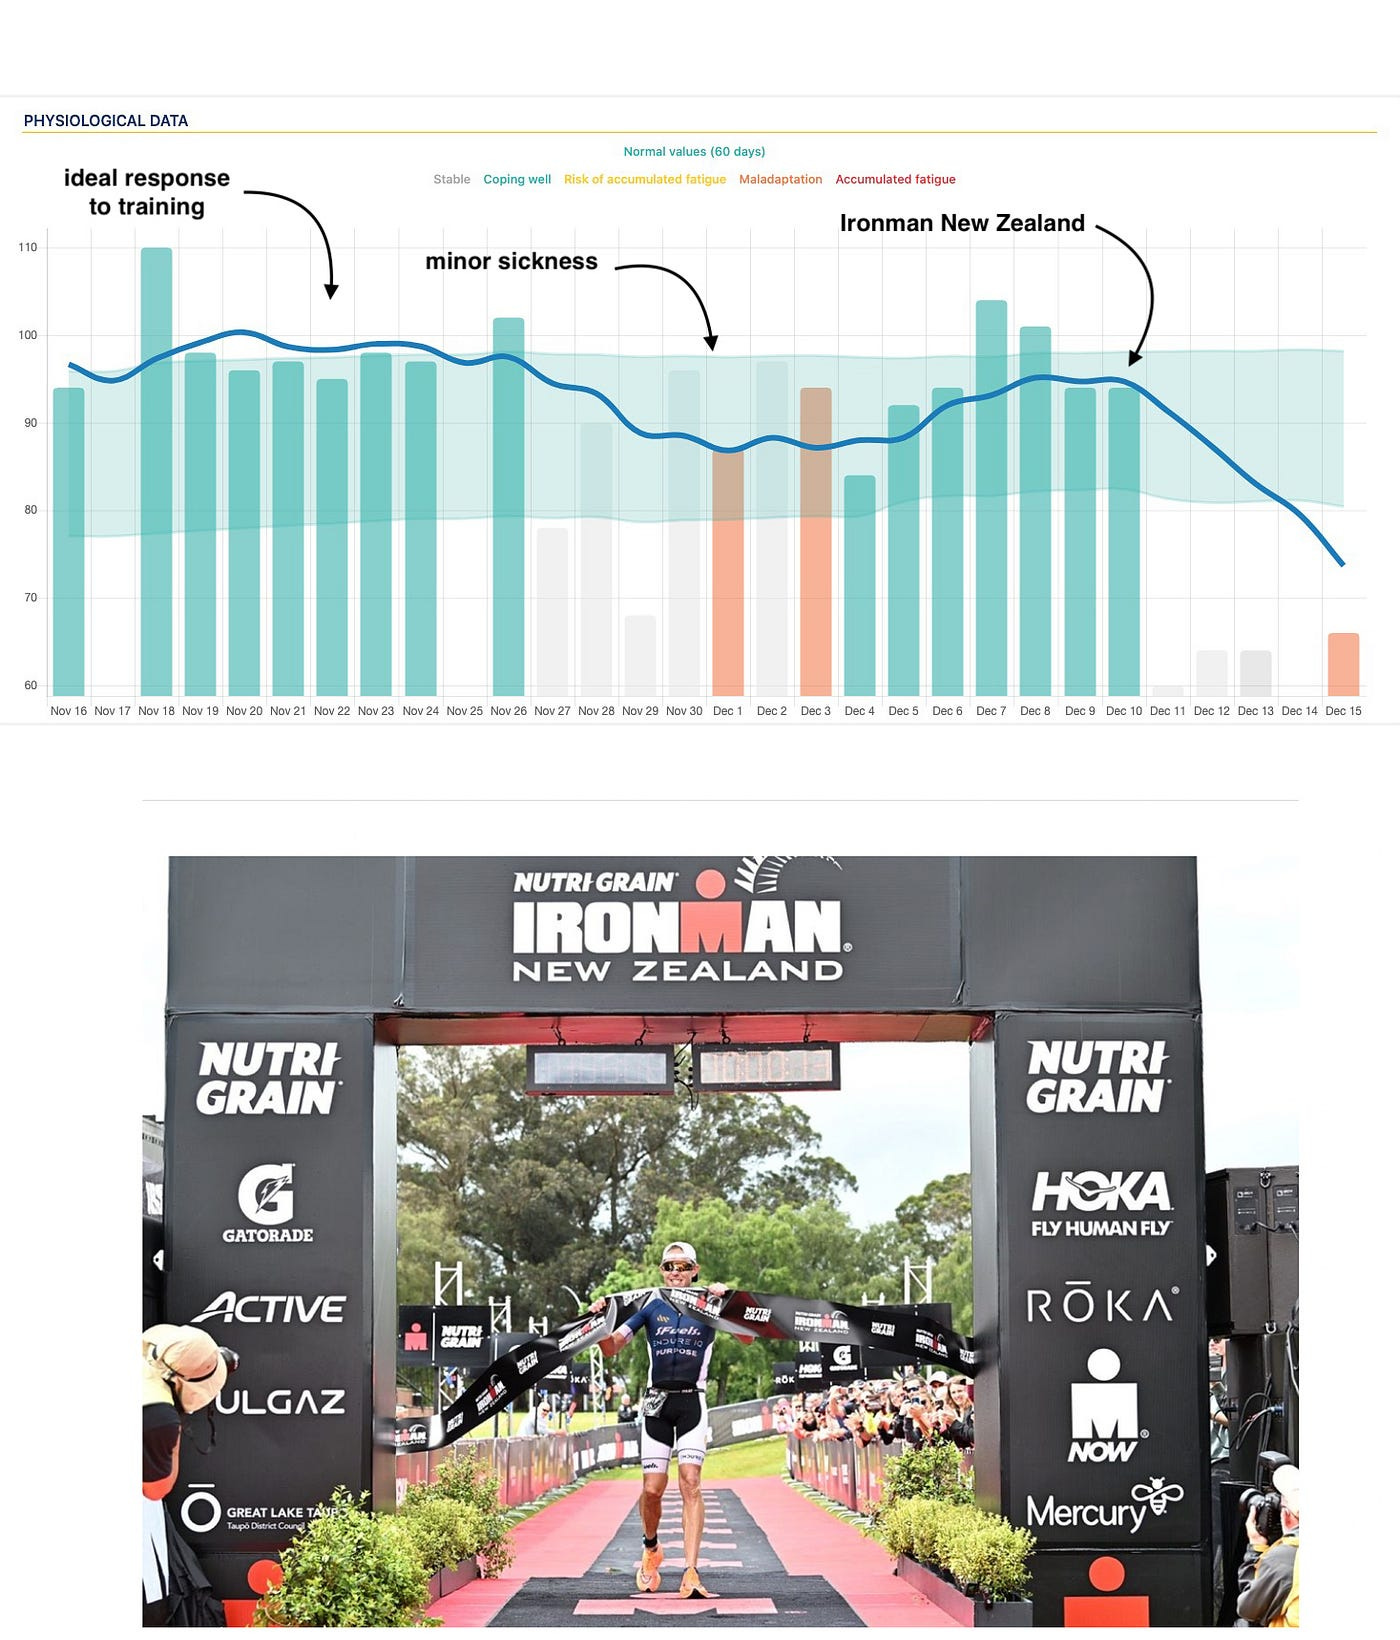
You can see some more examples below, where an individual’s normal range is highlighted by a light blue band, which makes it clear when HRV is significantly suppressed (for example when sick or after a big race).
These visualizations become more helpful as you gather a few months of data, and you can try them on HRV4Training Pro (use code SCIENCE for 20% off!).
Other useful resources:
Start by observing
I’d recommend just measuring and collecting data for several weeks (or even months!) so that you can start getting a feel of how you respond to various stressors and how the data reflects your choices in terms of both training and lifestyle as well as how it relates to subjective parameters.
There are various ways you can analyze your data without necessarily making changes, here are the two most common methods:
Acute changes: day-to-day variability in response to strong stressors.
Medium to long-term trends: long-term responses and adaptation to larger stressors.
Let’s look at both of them in more detail.
Acute changes: what happens after a strong stressor?
What’s an acute stressor? Acute stressors are events that affect your physiology in the immediate future. Think about an intense workout, an intercontinental flight, the menstrual cycle, sickness, a night out with too many drinks, high caffeine intake, etc. — anything that has an effect on your physiology that lasts from a few minutes up to 24–48 hours.
Acute stressors are typically the easiest phenomena to interpret and reproduce, and looking at data in the context of acute stressors can help understand how your physiology works. Looking at acute changes can also help in gaining confidence in the tools we use, as these changes should be captured and reproduced more easily.
It’s important to remember that physiology is complex, and while acute stressors and the resulting HRV changes are often repeatable and easy to understand, there might be other factors behind the relationships that we are seeing (or not seeing) in our data.
No stressor acts in isolation, there’s always something going on with our lifestyle, training, health, etc. — which is why HRV is such a useful tool to keep things in check, no matter what sport you do, there will be stress.
Let’s look at some data, for example, changes in HRV due to traveling and alcohol intake:
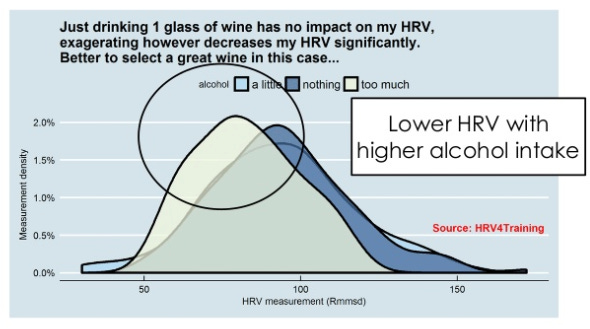
These are simple examples of how you can analyze your response to acute stressors in isolation, for example in the HRV4Training app, which provides this analysis for you:
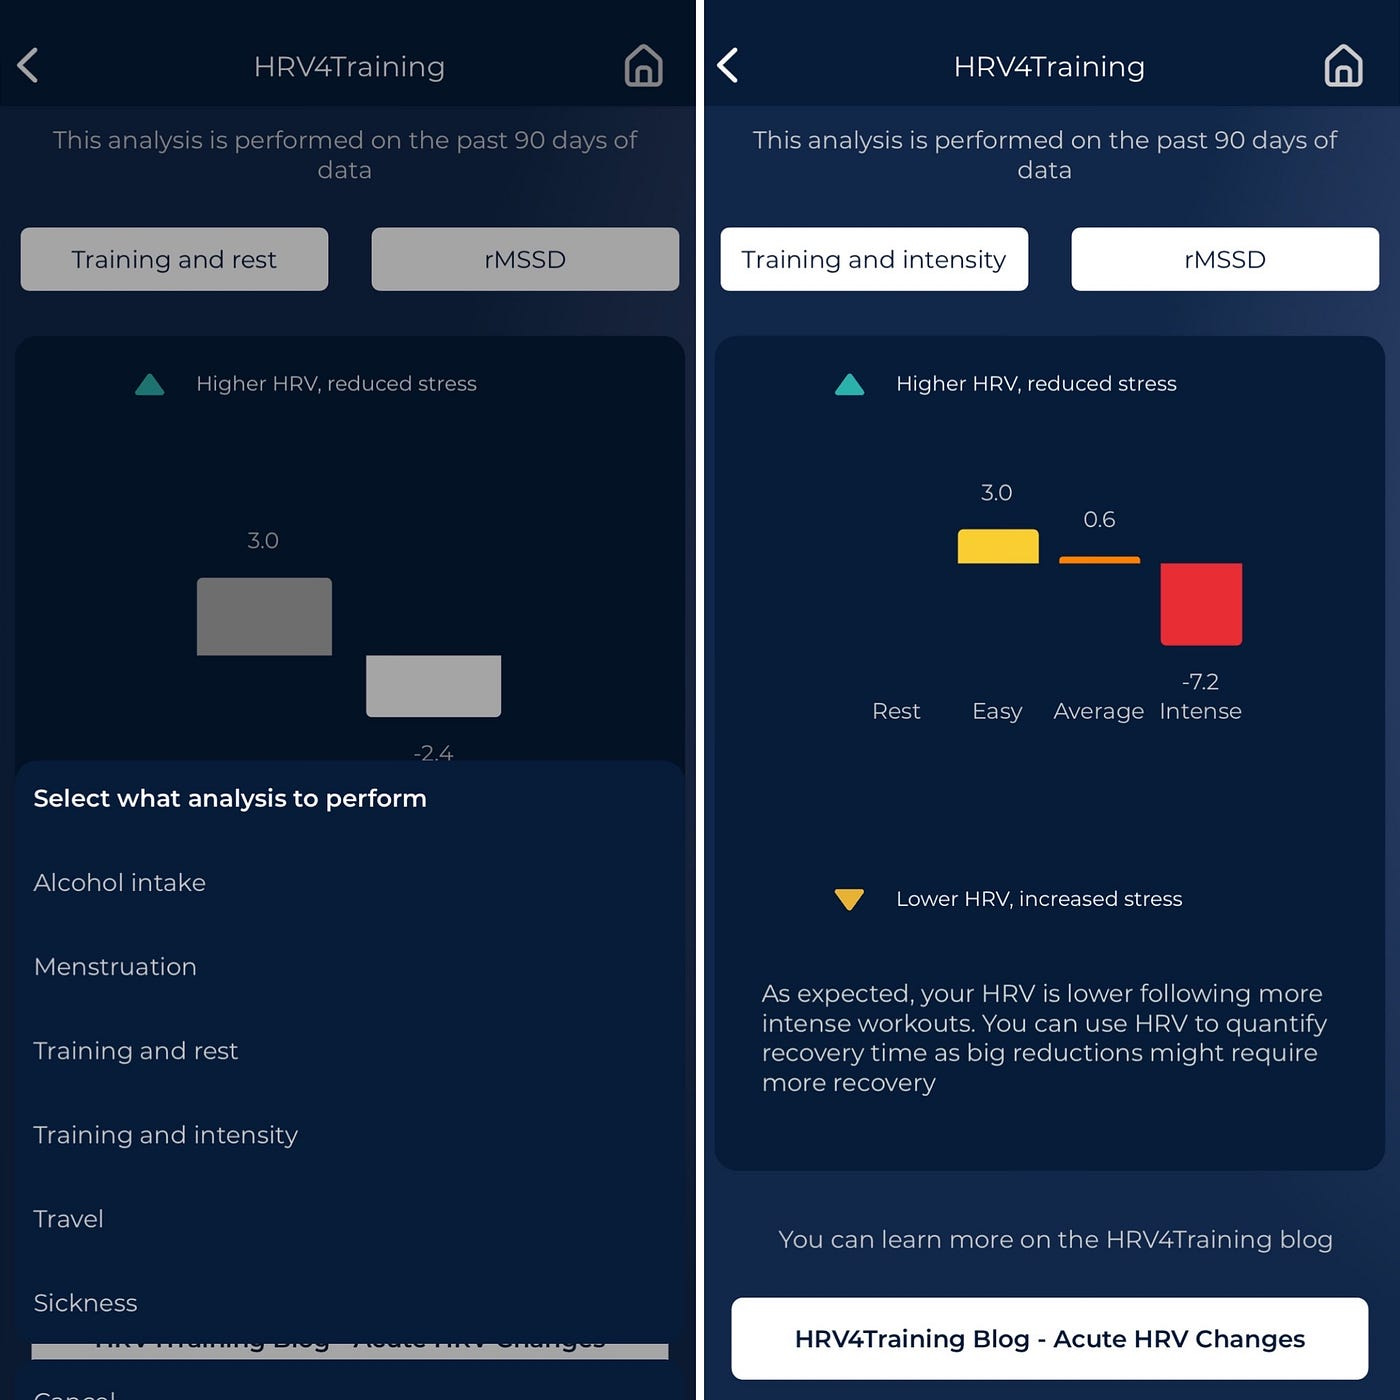
Let’s look at training as well, from an acute-response point of view. The rationale behind monitoring recovery using HR or HRV is that heavy training shifts the autonomic nervous system towards a sympathetic drive, which is reflected in higher HR and lower HRV within 24 to 48 hours after training.
To analyze this relationship between training and physiology, we can first compute day-to-day differences in resting HRV for a person. Subsequently, we can analyze the change in HRV on days following training of different intensities.
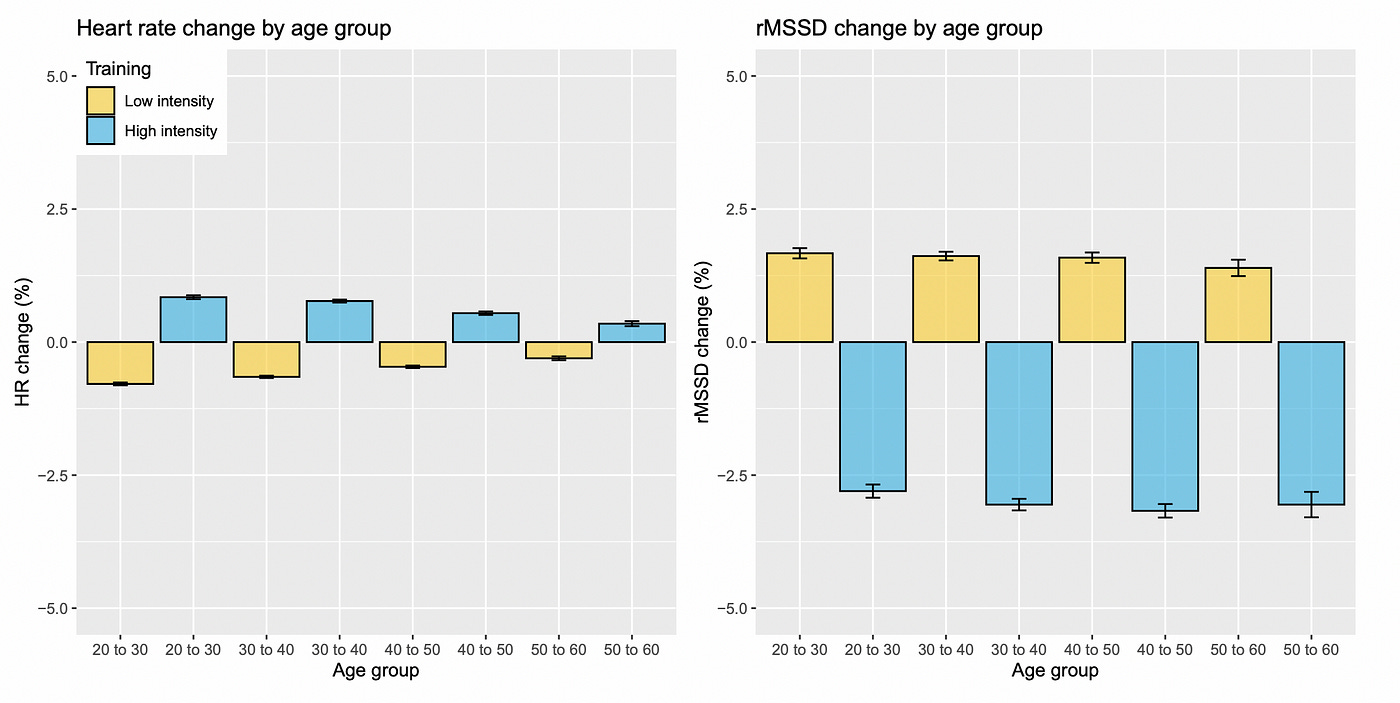
Here is, for example, a paper we published showing that measurements taken first thing in the morning, in unsupervised free-living settings (real life, not the lab!), clearly capture the different recovery demands of training of various intensities, across a broad population.
As you can see from the figure below, both heart rate and HRV capture recovery needs following training of different intensities, but HRV is more sensitive, and therefore more useful (the percentage change in HRV is larger, and remains the same across different age groups, while this is not the case for heart rate).
This analysis is also part of the acute HRV changes analysis shown before in the HRV4Training app, shown above.
If you are interested in this research, in the paper we also analyzed systematically the impact of training intensities, menstrual cycle, sickness, and alcohol intake.
As you can see from the figure above, there is quite a strong relationship between intense workouts and reductions in HRV on the following day. This is a typical acute stressor, and the reduction in HRV can be used to quantify recovery and understand if we need an extra day off.
However, this relationship does not tell us much about long-term adaptations to a training block or training program (as well as other lifestyle stressors). That’s what we will learn by looking at medium and long-term trends.
One last important point to discuss here. The view that training should cause a dip in HRV is very simplistic, HRV is a measure of physiological stress — or even better: a measure of how we are adapting and responding to stress. While higher stress is typically highlighted by a reduction in HRV, positive adaptation to stress (think for example about an intense training block) should result in a stable or increased HRV. Only in case of issues such as too much of a stimulus (e.g. intensity or volume) or non-training related stressors, you should see a reduction.
Let’s look at some data from a different angle to clarify these points.
Long-term changes: how are you responding and adapting to training and lifestyle stressors?
Heart rate variability (HRV) trends over long periods of time (e.g. from weeks to months) are one of the most interesting and complex aspects to analyze when it comes to resting physiology.
Analyzing our responses acutely (e.g. right after a stressor) shows clear patterns, however, there is often a difference between the short (or acute) and long-term (or chronic) effects of a stressor. For example, our HRV immediately after a hard session will reduce (acute effect, see also this blog). However, a positive response to that session, as well as other factors resulting from consistent training, even when part of a high-intensity or volume block, should result in a stable or even higher HRV in the long run (chronic effect, or trend, as discussed in the same blog).
Day-to-day HRV guidance can be useful to make small changes to our overall training plan. If today we are down, we can easily adapt and move our intense training by a day, or make some other small adjustments to better balance the different stressors we face. However, this kind of analysis cannot say much about the big picture. How is our overall condition? How are we responding to a new training phase? Are we at risk of non-functional overreaching or maladaptation? Analyzing trends can help you answer these questions and provide a better understanding of our overall physiological response.
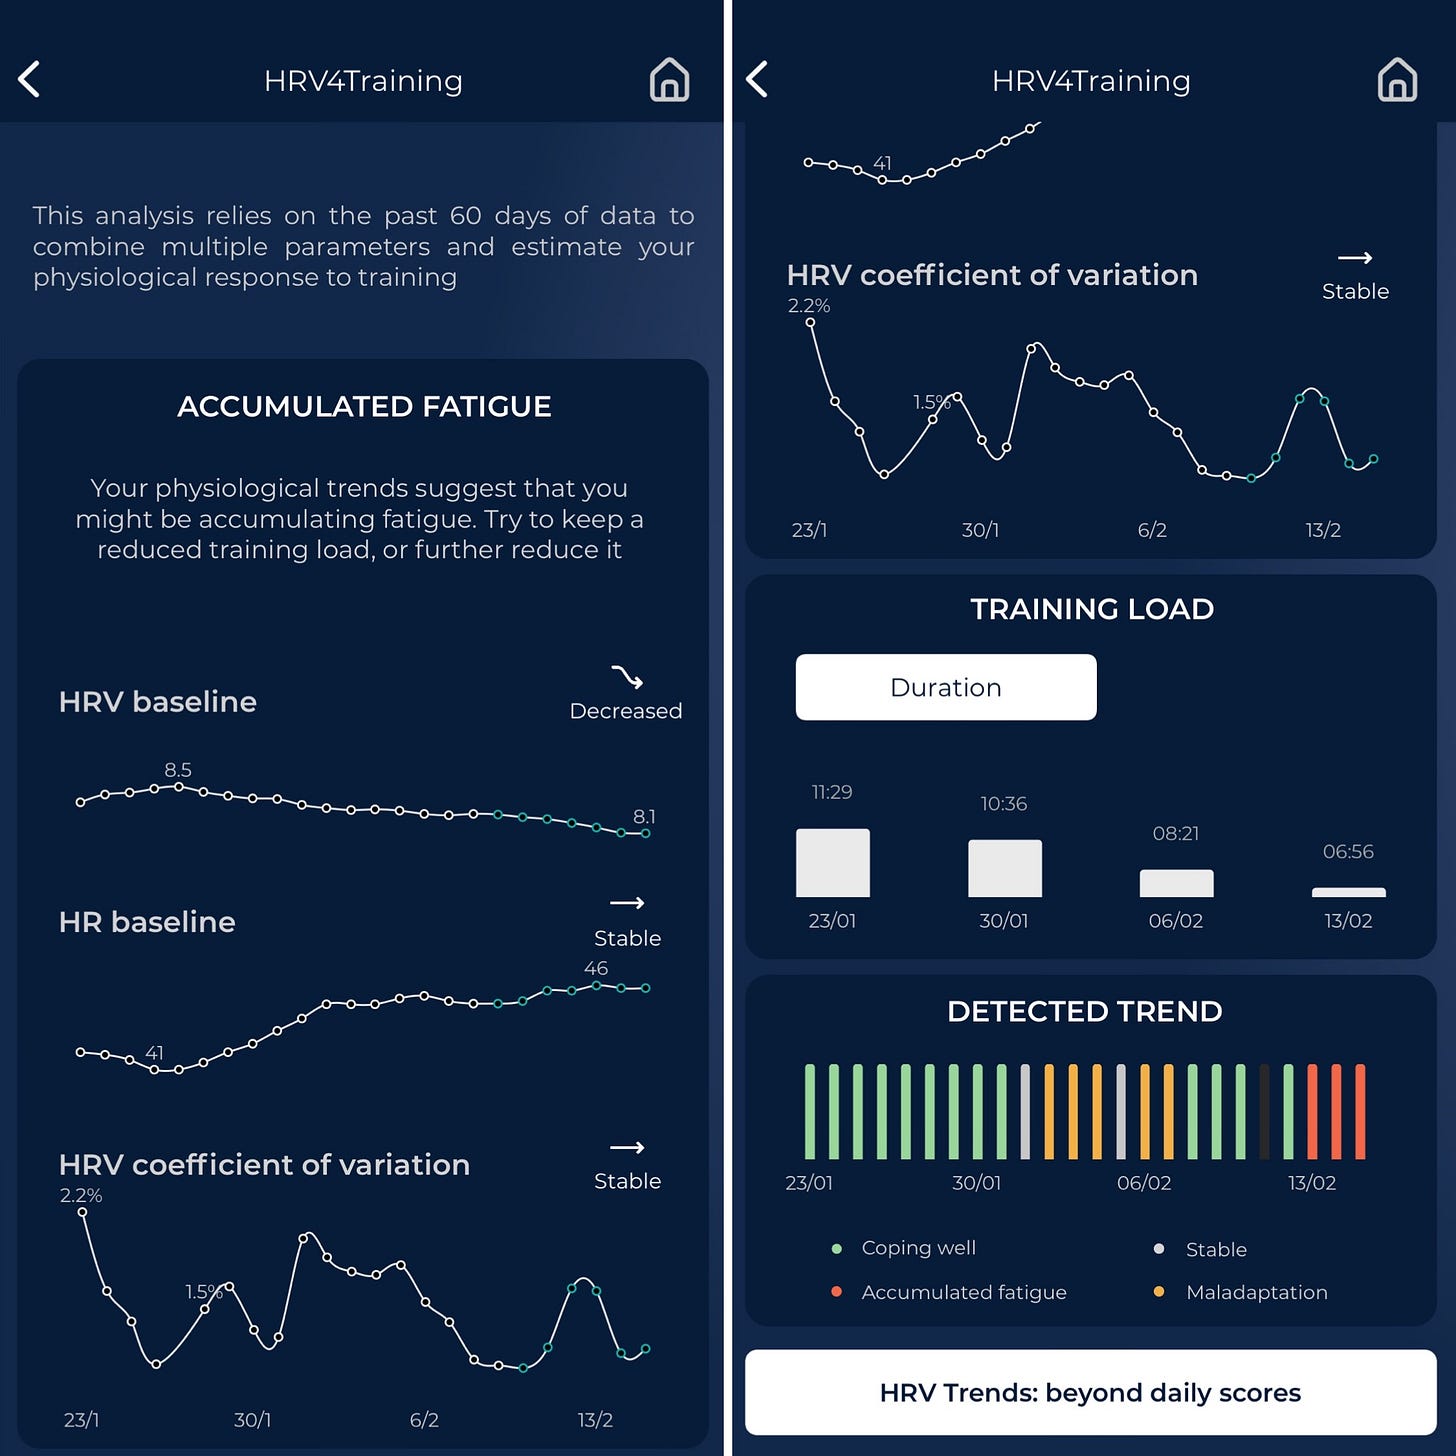
Looking at multiple parameters is a must in the context of trying to understand long-term trends. In HRV4Training, I have implemented the following parameters, which I report here together with a basic interpretation of their use:
HRV (ln rMSSD): an increase is typically associated with coping well with training and improved fitness level. A reduction is not necessarily bad, it could be associated with parasympathetic saturation or tapering. Looking at heart rate can help figure out the different situations. Most importantly, HRV should always be considered in the context of a specific training phase. For example, an increase in HRV during a high-load phase is typical when good athletes are responding well to the stimulus and might be associated with other physiological mechanisms such as increased blood plasma volume. Such an increase in HRV during high-volume training can be considered a sign of functional overreaching, that’s an ideal response. A reduction in HRV outside of tapering and with stable or increasing resting heart rate is typically a sign of a poor physiological response to either acute or chronic stressors.
Resting heart rate: in general, an increase is associated with more fatigue if acute, or less fitness if chronic unless it is occurring during tapering. A reduction is most of the time associated with coping well with training and better cardiorespiratory fitness level, especially if we talk about trends analyzed over several weeks or months. A stable trend is ideal. Note that seasonal patterns are present (e.g. resting heart rate tends to be lower in summer), and therefore changes should always be analyzed with respect to your normal values, as we do in the HRV4Training app.
Coefficient of variation of HRV: A decrease associated with higher HRV and lower resting heart rate can be representative of coping well with training, while a decrease associated with lower HRV is probably representative of the risk of non-functional overreaching. An increase in the coefficient of variation might reflect some trouble in adapting to a new training block (or other stressors, such as travel or altitude) and if associated with reduced HRV might be a warning sign of inappropriate training load.
Normal range: one of the difficulties of analyzing trends is due to the choices we need to make in terms of the amount of data used for this analysis. For example, after a negative response, resulting in a reduction in HRV, we might have stable trends, but still far off from our normal range. This is why I included also the normal range in our multiparameter trends analysis, so that periods of long, abnormal responses, can be better quantified.
HRV4Training combines multi-parameter data to help you better understand the big picture. Looking at baseline changes in HRV, heart rate and the coefficient of variation of HRV, the app can automatically determine if your recent trends are changing in a trivial way, or if the change is something to take more seriously, based on your historical data. Once the various trends have been analyzed, HRV4Training will determine your physiological response to training as one of the following categories: stable physical condition, coping well with training, maladaptation to the current stimulus, or accumulated fatigue.
In general, stability is what we should aim for. Stability does not mean lack of stress: remember that this is the body’s response measured at rest, hours after training, or other stressors (ideally, in the morning). If we are able to cope and respond positively to the stressors we face, we expect our HRV to bounce back quickly, and therefore stability highlights the ideal response in most cases.
Other useful resources:
Context is key
Training is hardly the only stressor in anyone’s life, no matter if you are a professional athlete or just went for your first run yesterday. There’s work, family, expectations, etc. — we need to deal with a lot more than just training, and it all affects us physiologically.
Below you can see an example of altered physiology during the menstrual cycle, typically resulting in a suppression of HRV and increased resting heart rate during the luteal phase (second half of the cycle):
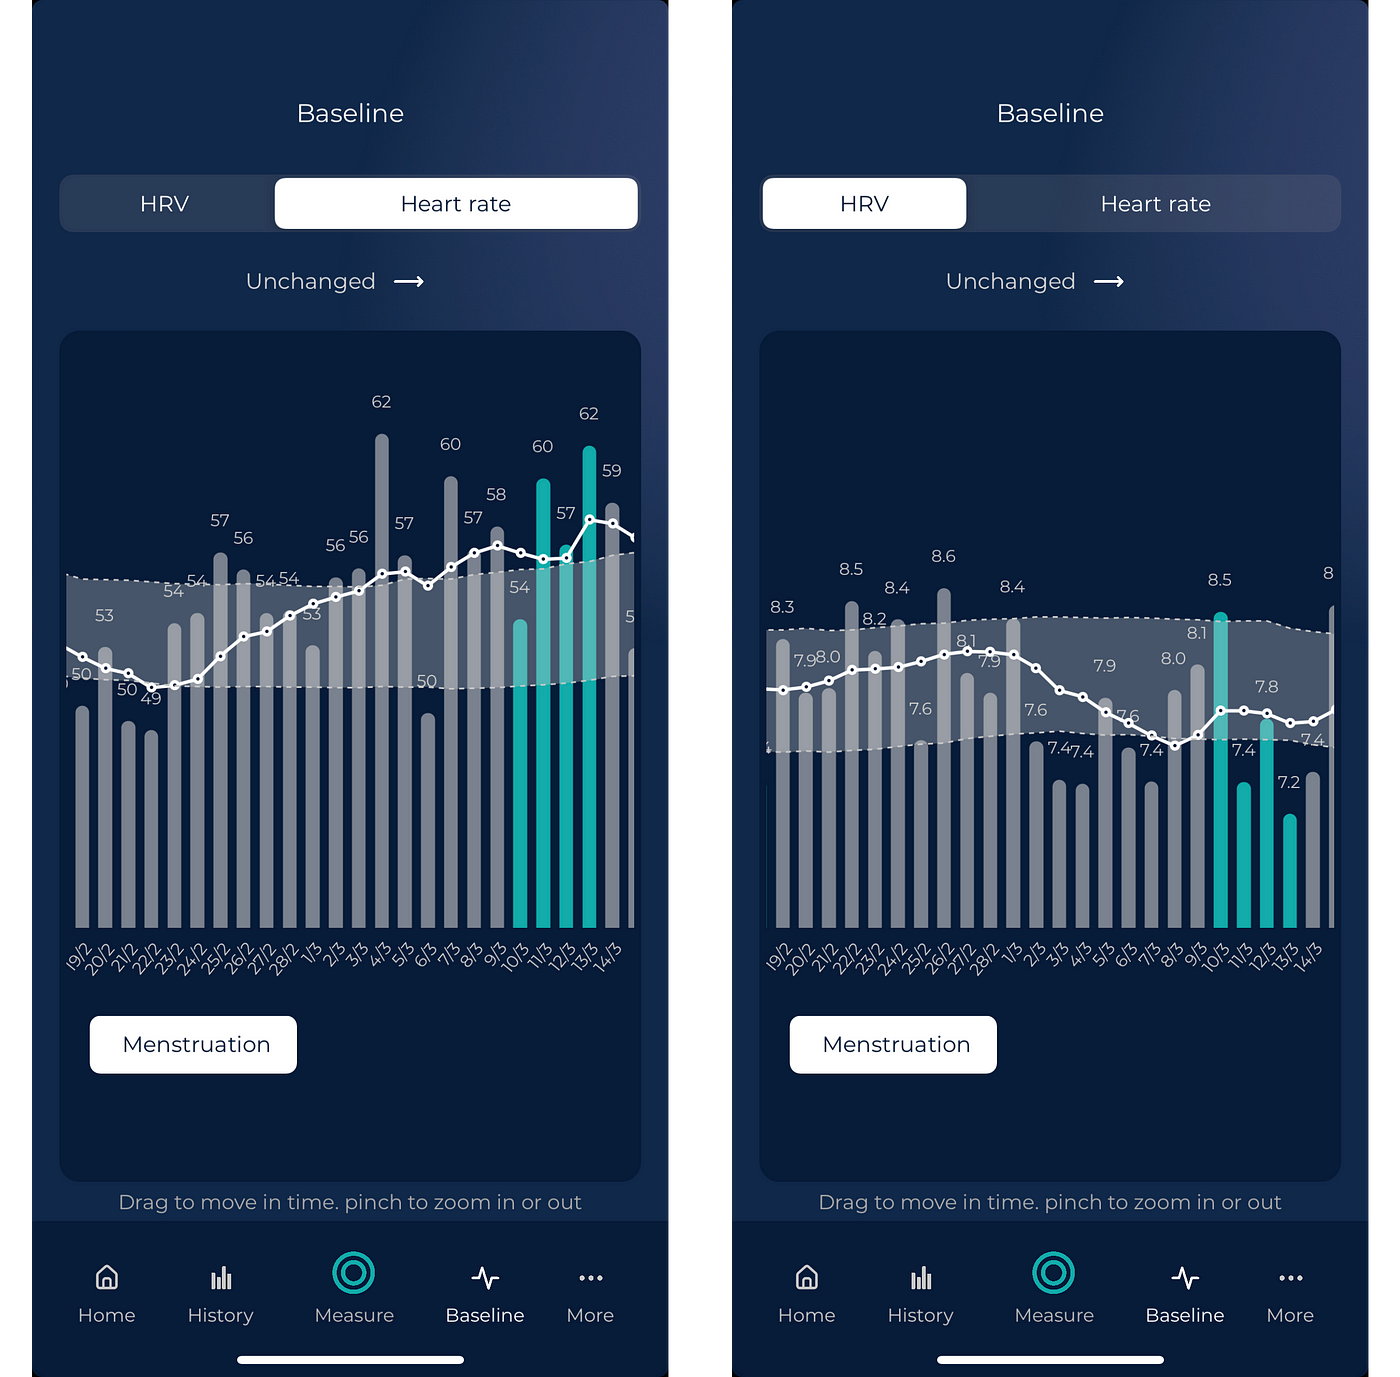
This is the whole point of HRV monitoring, it’s naive to think that the only thing that matters is training, and no matter what sport you do (or do not do), measuring your response to stress can help you get back on track.
It makes no sense to look at your HRV data decontextualized. HRV represents your response to training and lifestyle stressors, and you need to look at how things are changing with respect to those stressors, as shown in HRV4Training Pro for example.
Make sure to collect data properly, as explained in Part 1, and you’ll be able to see useful trends over time.
How do you feel?
How you feel is an important part of capturing context around your measurements. Sometimes your subjective feeling will be in line with what you see in the data (for example, your HRV is within normal range and you are feeling good). Other times, the data might capture stressors that are not obvious yet (for example, a suppression in HRV before getting sick, or more chronic stressors slowly creeping in). Subjective feel and HRV are not supposed to reflect the same aspects or align over time.
Subjective metrics and being able to assess how we are feeling are key and provide invaluable context. This is why we include a questionnaire after the measurement so that you can take a minute to pause, and self-assess how you are feeling subjectively, a key part of the process if data is to be used to improve our self-awareness. This is unfortunately an aspect ignored by wearables, where everything is automated, and instead of improving our self-awareness, we end up influencing our subjective state without even trying to think about it, by looking at automatically collected data (and made-up scores) as soon as we wake up. We believe in a different approach, in which you first assess subjectively how you feel, measure intentionally, and only after look at your physiological state. This way the data can aid this process. As you gather more data, you can learn to fine-tune your subjective feel and assessment based on your objective response to the various stressors you face.
Training load, HRV, and subjective metrics all provide important information that needs to be integrated daily, to decide the better course of action.
Now let’s make some adjustments
So far we have seen how HRV data can be used to better understand how we are responding and adapting to various stressors. While this is a key first step towards improved health and performance, we have yet to make any changes.
In my opinion, HRV should be used as a continuous feedback loop, so that in the long term, what you improve is health and performance (by for example providing the right stressor at the right time, as shown by research on HRV-guided training), and not HRV itself. This is different from for example even just resting heart rate (or even better, submaximal heart rate during exercise), which typically is highly correlated with changes in cardiorespiratory fitness and reduces as you get more fit. This is also why HRV is not a good predictor of fitness (as I cover here).
How do you integrate HRV with your training plan? Should you have a plan at all?
Let’s revise the basics: HRV is simply a way to capture parasympathetic activity, or in other words, the level of physiological stress. As we apply stress to trigger certain adaptations, measuring our body’s response to such stressors, as well as to all other forms of stress we are affected by (e.g. simply life happening, work stress, family, etc.), is very helpful as it can provide objective feedback and help us make meaningful adjustments.
The simpler adjustments are probably just being a little more honest with ourselves, and slowing down from time to time, especially when our body is already too stressed. The example we’ve just highlighted is something we all understand quite well, higher stress as shown by lower HRV highlights how it might be a good idea to take it easy and avoid excessive stress which might lead to overtraining or slower recoveries, hindering improvements in performance.
When everything is within your normal values or in other words a green light, should give you confidence that everything is going well and in general, you are coping well with your current training and lifestyle. Yet, if your training plan says you are due for a rest day, take it. If you are due for a low-intensity workout, do it.
It is important to understand that HRV and physiological measurements are tools for awareness, which allow you to understand how you respond to a particular plan, not to replace your plan entirely.
Now that you have seen how you can interpret your measurements by looking at relative changes over time you should be able to make the most of your data.
Keep an eye on this blog for more resources.
Personal Coaching for Runners
If you are interested in working with me, please learn more here, and fill in the athlete intake form, here.
Marco holds a PhD cum laude in applied machine learning, a M.Sc. cum laude in computer science engineering, and a M.Sc. cum laude in human movement sciences and high-performance coaching.
He has published more than 50 papers and patents at the intersection between physiology, health, technology, and human performance.
He is co-founder of HRV4Training, advisor at Oura, guest lecturer at VU Amsterdam, and editor for IEEE Pervasive Computing Magazine. He loves running.
Social:



Gracias por tu valiosa aportación Marco.
Mi pregunta es sobre porque y como HF se correlaciona con la actividad parasimpatica del nervio vago. En base a qué comportamiento biofisiologico se le atribuye a la HF el signo de la participación del nervio vago y parasimpatico.
Muchas gracias.
Wow! I am getting such an education! I am glad to hear that I don’t need to stress over my low HRV. I have been fascinated by HRV since getting my Fitbit and seeing the negative impact of alcohol and the positive trend I can influence through exercise. I am also interested in the connection between HRV and insulin levels.
I want to use your apps to track my efforts in treating my body better instead of relying on the scale (so much dieting and so much angst). At 58, I just want to work on improving my health, especially heart and brain. I am retired but I am also dealing with my mother’s Alzheimer’s so my stress level is often through the roof.
I bought your app bundle and have used the biofeedback and HRV measurement. It seems like what I really need is the HRV training, and biofeedback. Is that what you would recommend?
Thanks again for these clear, detailed articles!
Sue