Stability in heart rate variability
A training perspective
As I continue my attempt to shift the conversation around a better HRV towards the importance of a stable physiological response, I’d like to cover here the reasoning, research, and practical utility of this different viewpoint, especially in the context of training (even though you can easily extend it to other stressors).
In particular, there are two main aspects that I’d like to communicate:
A stable HRV is a clear sign of a positive response, even (well, especially) in the presence of strong, acute stressors such as hard training.
A dip in HRV is a sign of a negative response, disrupting such stability, due to a mismatch between the stimulus and the athlete’s abilities. An alternative explanation behind a negative response is the presence of non-training-related stressors.
Acute HRV response to training stress
When I talk about stability, many think I am arguing in favor of avoiding stress. In fact, stability does not mean a lack of stress. Stability means that our fitness and capacity to handle stress are well-developed, and we bounce back very quickly after a strong stressor.
Let’s look at some key figures from Stephen Seiler’s 2007 paper (full text here) to better understand this key point.
What happens when we apply a stressor, say a workout? HRV is suppressed: the body’s stress response causes the autonomic nervous system to increase sympathetic activity, and reduce parasympathetic activity. In turn, the autonomic nervous system impacts heart rhythm, reducing its variability, which we can measure with a heart rate variability monitor.
If we look at HRV at different time points after workouts of different intensities, this is what we see:
As you can see, easy workouts (below the first ventilatory threshold) should lead to an immediate normalization, while hard workouts can take several hours for HRV to renormalize. This explains also why night HRV measurements and morning HRV measurements differ: night data can be more tightly coupled with what you did before, as the measurement comes earlier, while morning data will be more representative of your readiness for the day (deeper discussion, here).
In any case, unless something goes wrong (we’ll see what this means in a second), we expect HRV to bounce back to normal within a few hours.
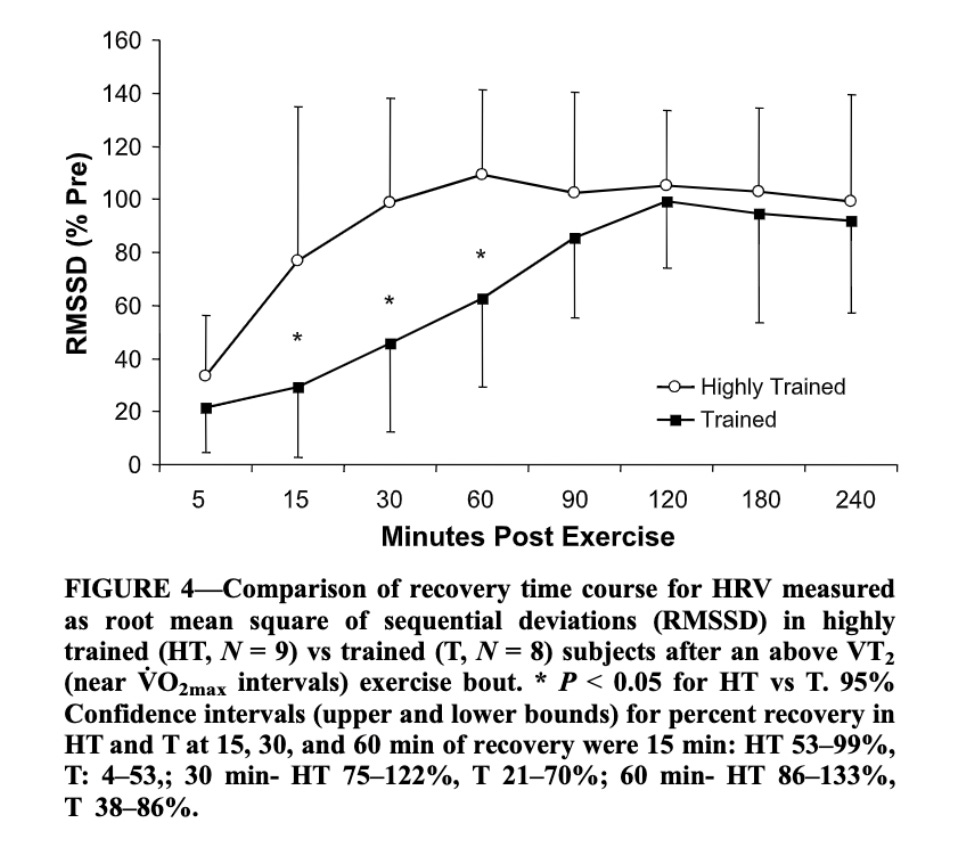
Now let’s take another figure from Stephen’s paper, where we look at the same data, but grouped by athlete’s fitness level. This is really an important one:
In the figure above we can see that the renormalization of HRV after a hard effort is much quicker for highly trained individuals.
Stability is reached earlier. A common question I get in podcasts or interviews is if we should expect our HRV to sink or if we should intentionally dig really deep (some companies even promote this idea). The answer is a resounding no. Highly trained athletes, experiencing the same hard workout (as intensities are relative to their ability) will recover and renormalize quickly: they reach an optimal state of stability before less trained athletes.
When could we see a suppression in HRV then?
Normally, in two cases (credits to Andrew Flatt for this breakdown):
The stimulus is inadequate, e.g. too hard for the athlete’s training history or fitness, or the stimulus is novel. If you “sink your HRV” you simply applied a stimulus you are not ready to absorb, and therefore will likely not benefit from. The better you are (e.g. highly trained) the faster you’ll recover, even from hard sessions. We’ll see below how the HRV of professional athletes typically looks like, when training really hard (hint: it’s stable).
There are non-training-related stressors taking over. Needless to say, we cannot talk about training as the only stressor. Lifestyle, psychological stressors, sickness, etc. - will all have an impact, and might cause a negative response (e.g. a drop in HRV) even when the training stimulus is adequate.
Let’s look at a case study to get a bit more practical on these aspects.
Case study: positive and negative responses
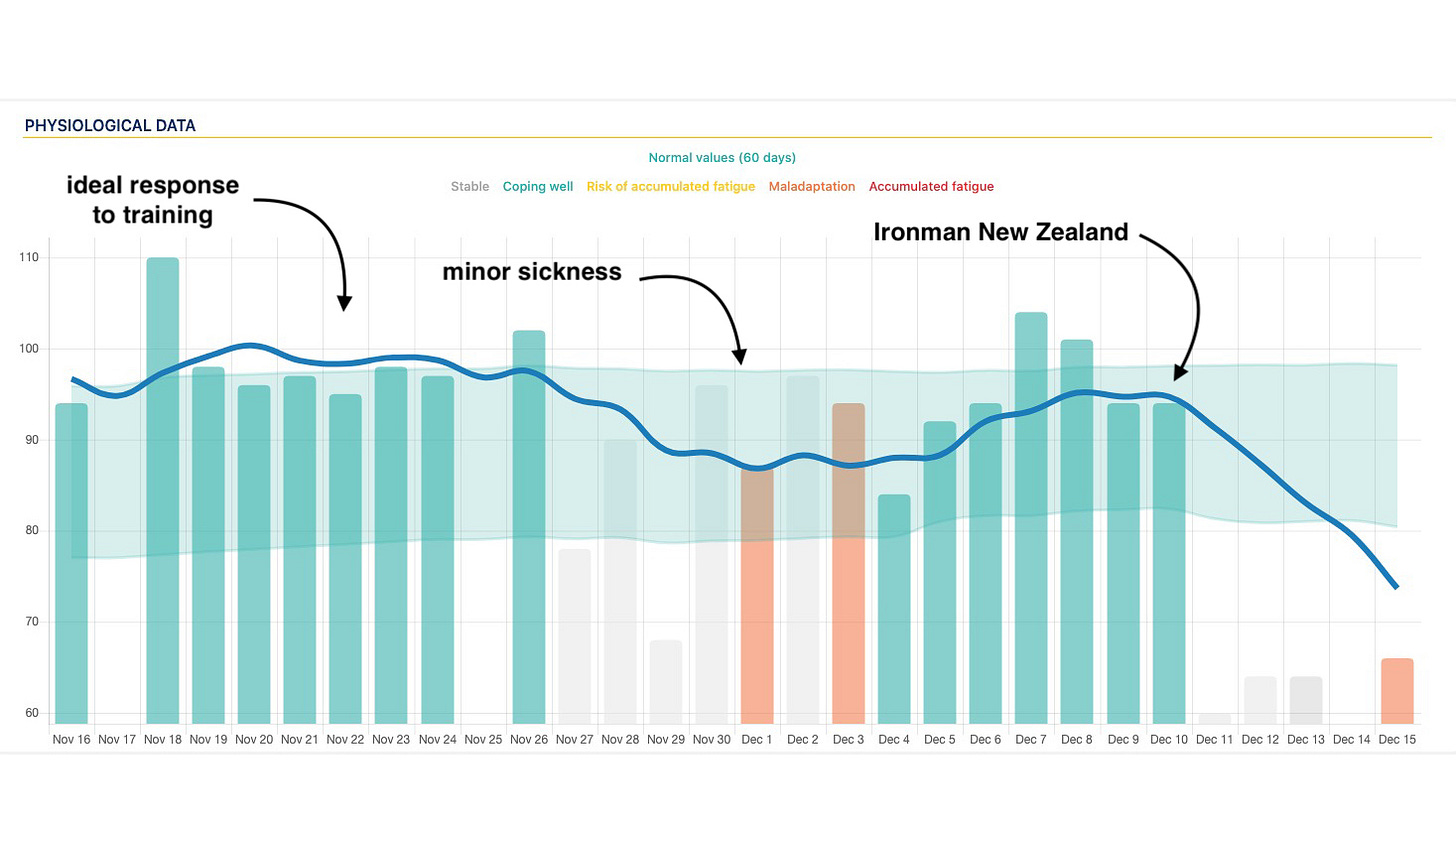
Below is Dan Plews, a brilliant scientist and athlete, winning Ironman New Zealand a few weeks ago. Dan was kind enough to share his data, which we can use to analyze some of the statements above about optimal responses to hard training (a stable HRV) and poor responses.
In particular, below are the weeks prior to his Ironman New Zealand win, together with the few days after the race, for his HRV data:
In mid-November, at the beginning of the figure above, Dan’s data shows an ideal response to training, with very stable values and a baseline towards the high end of his normal range. He is certainly training hard, but we see no dip whatsoever in his HRV. During this phase, the training stimulus was adequate for his training history and current fitness. He bounced back quickly, as we saw in the figures above from Stephen’s paper.
Towards the end of November, he gets sick, and we have a few suppressions in HRV, but fortunately bounces back quickly before the race.
After the race, we see a large suppression, way below his normal range. A race like an Ironman is not a training stimulus, but a different class of effort. Here we expect a reduction, which in this case might have been further compromised by the previous sickness.
Despite what some companies push (e.g. naive “higher is better” interpretations, combined with recommendations to “dig deep” and sink your HRV from time to time), the data of world-class athletes show a very different picture: very consistent and stable numbers unless something is really wrong (sickness, or major key events raced once or twice per year).
How do we analyze stability in HRV?
We can use the coefficient of variation to analyze stability in HRV data. The coefficient of variation is the amount of day-to-day variability in your HRV scores. This is different from your baseline, which is simply the average of your score over the past week
Let's look at an example to make things more clear. If your baseline this week is 8, it could be that you had a few days with very similar scores, say 7.9, 8.1, 8, etc. or it could be that your scores were jumping up and down quite a bit more, say 6, 10, 7, 9, etc. - in both cases averaging at 8, your baseline.
Got it? The amount of variability in your scores over many days is the coefficient of variation. In the first case with similar values, the coefficient of variation is small (there is little day-to-day variability), while in the second case, the coefficient of variation is large (more day-to-day variability). Note that as always, small and large are both determined based on your historical data, everything is relative and some people just have more variation than others, between consecutive days.
The amount of day-to-day variability, combined with baseline changes with respect to your normal values, can provide additional insights on adaptation to training and other stressors, which is why stability is so important.
From Flatt et al. ”Thus, the preservation of autonomic activity (no change in baseline HRV) and less fluctuations (reduced coefficient of variation) seem to reflect a positive coping response to the training. In fact, individuals who demonstrated the lowest LnRMSSDcv during week 1 of increased load showed the most favorable changes in running performance (r = -0.74).” (Paper here).
The coefficient of variation in HRV4Training
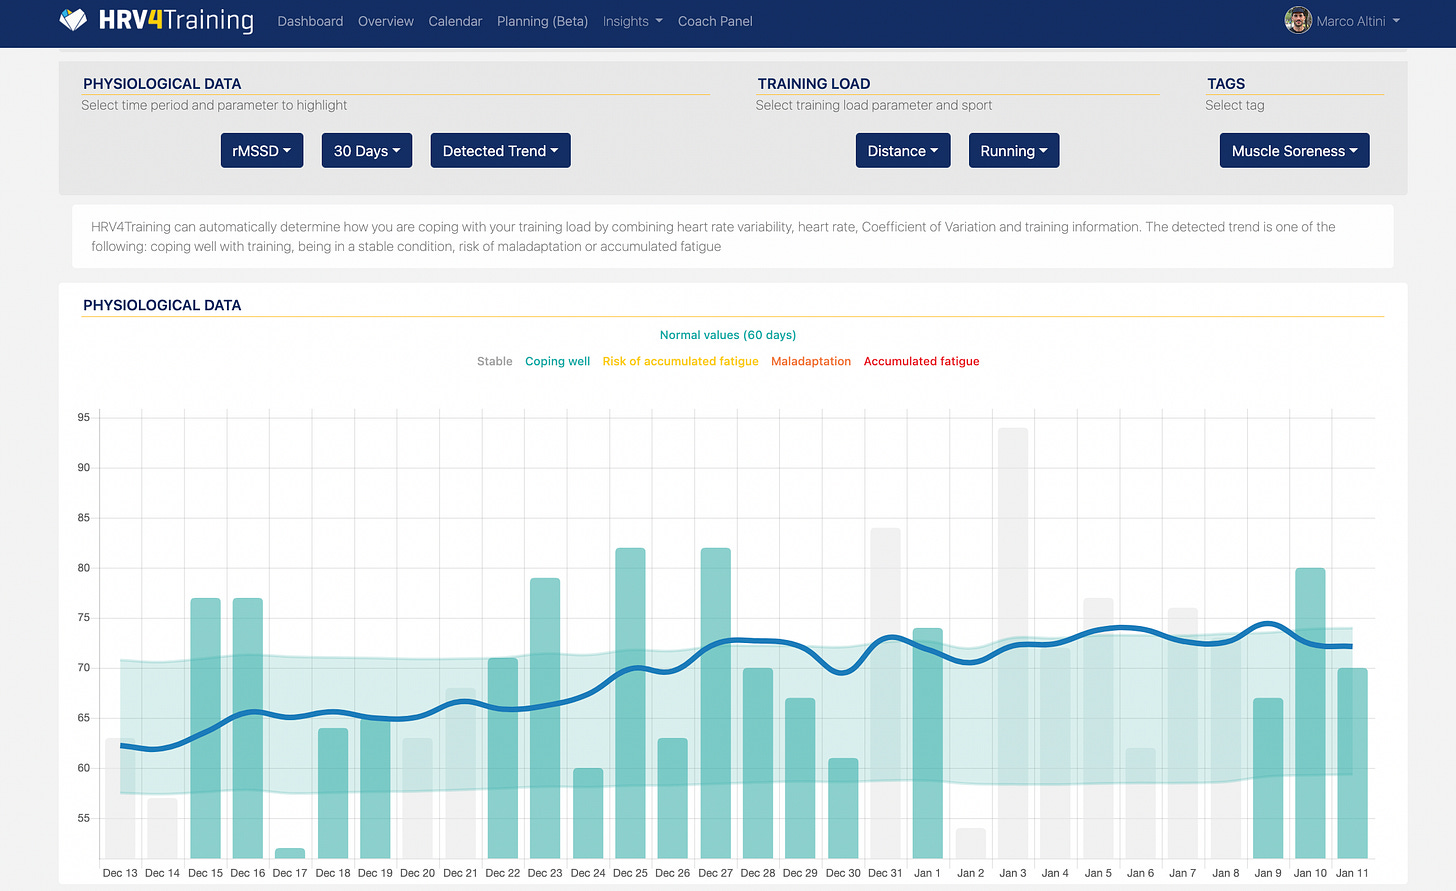
If you use HRV4Training Pro, we compute the coefficient of variation, but also allow you to look at how it changes with respect to your daily scores, baseline, and normal range. Below is an example of my last month of HRV data, color-coded using the coefficient of variation:
I have some more marked ups and downs in HRV around the new year, which are then reported as a yellow coefficient of variation for the following period, which means that my coefficient of variation has increased with respect to the previous weeks. Later, towards the end of the graph, things stabilize as I approach my 10 km race (Jan 8th), and remain stable afterward: an ideal response to a short, high-intensity stimulus, that should not cause any larger disruption, if 1) we have trained for the event 2) what follows is adequate rest and nutrition.
A reduced coefficient of variation is often associated with coping well with training. What we are measuring is how we are responding to a workout or block of workouts, with certain trends (stable or upwards HRV, reduced coefficient of variation) being indicative of good responses, even in periods of very high load.
This means also that the opposite trends, reductions in HRV, or larger fluctuations in the coefficient of variation are signs of poor responses and should be more carefully evaluated.
When is stability negative?
By now, we all love stability in HRV. However, there’s a catch.
Stability is key when our HRV is within normal range or trending high. However, if our HRV is highly suppressed, below our normal range, and we are stably suppressed, this is far from an ideal state.
This is why it is important not to look at a single parameter in isolation. In HRV4Training, the coefficient of variation is a key parameter used in our trend detection, in combination with your baseline HRV, heart rate, and normal values, so that we can try to determine your response using a multi-parameter approach.
If you look at Dan’s data above, color-coded by the detected trend, you can see that we are able to detect issues in the response (labeled as “maladaptation”, in orange), in two cases:
When his HRV is still within normal range, with a stable baseline, but the coefficient of variation has clearly increased. This is what happens during sickness.
When his HRV is highly suppressed, post-race, even though his coefficient of variation is rather stable (very similar, low values).
Here is another example using my data:
My response in the past month was always positive (“stable” or “coping well”). We saw earlier how my coefficient of variation was not ideal for a few days, as my data was not too stable. However, my baseline HRV was trending well, towards the higher end of my normal range (and similarly my resting heart rate was trending low, not shown here), and therefore the system detects a “stable” condition (shown in gray). When the coefficient of variation reduces, the system detects “coping well” again (in green). You can learn more about long-term trends in resting physiology, in my blog here.
Takeaways
The stress response to training is clearly captured by HRV in the hours following exercise.
The intensity of the stimulus (e.g. below or above the first ventilatory threshold) and the fitness level of the athlete will determine how long the recovery will be.
A stable HRV highlights an ideal response. This is true even when training hard. A stable HRV does not represent a lack of stress but highlights a great ability of the system to respond and renormalize quickly.
An unstable HRV or low HRV the day after training highlights a mismatch between the stimulus and the athlete’s fitness (time to rethink the training plan) or the presence of non-training-related stressors.
You can use the coefficient of variation in HRV4Training to analyze the stability of your HRV. We then combine it with your baseline HRV, heart rate, and normal values to determine the most likely physiological response.
Marco holds a PhD cum laude in applied machine learning, a M.Sc. cum laude in computer science engineering, and a M.Sc. cum laude in human movement sciences and high-performance coaching.
He has published more than 50 papers and patents at the intersection between physiology, health, technology, and human performance.
He is co-founder of HRV4Training, advisor at Oura, guest lecturer at VU Amsterdam, and editor for IEEE Pervasive Computing Magazine. He loves running.
Social:






Thank you for the great content! Easily understood information of a complex topic. HRV4TRAINING is proving to be a game changer for me with my training and ability to manage my overall health and fitness.
Thanks for te content! HRV4Training is brilliant.
Are there fixed percentage values from which the coefficient of variation can be considered to recognize whether it is reduced or optimal? So, I think that %CV can be similar within intersubjects.