
Sorting out metrics confusion
do you know what you are doing?

There are often reports of inconsistent outputs from different tools people use to track various metrics, e.g. apps or wearables for heart rate variability (HRV).
Typically, it is not really an inconsistency but just a matter of understanding what is going on: e.g. when and how things are measured, and how the data is turned into messages or scores.
The more you understand the physiology and the technology, the better use you can make of it.
In this blog, I want to show you a simple example of what I mean, and how what seems inconsistent output makes in fact a lot of sense when we understand what we are doing and how the tools work.
Case study
Yesterday I ran 6 hours, it was a bit warm and I didn’t have a great day. At the same time, I am also in the best shape of my life, and I train for this. What I expect is a small acute change in my resting physiology, to be normalized within 48 hours.
I measure my HRV in two (actually three, more on this later) ways:
full night using an Oura ring
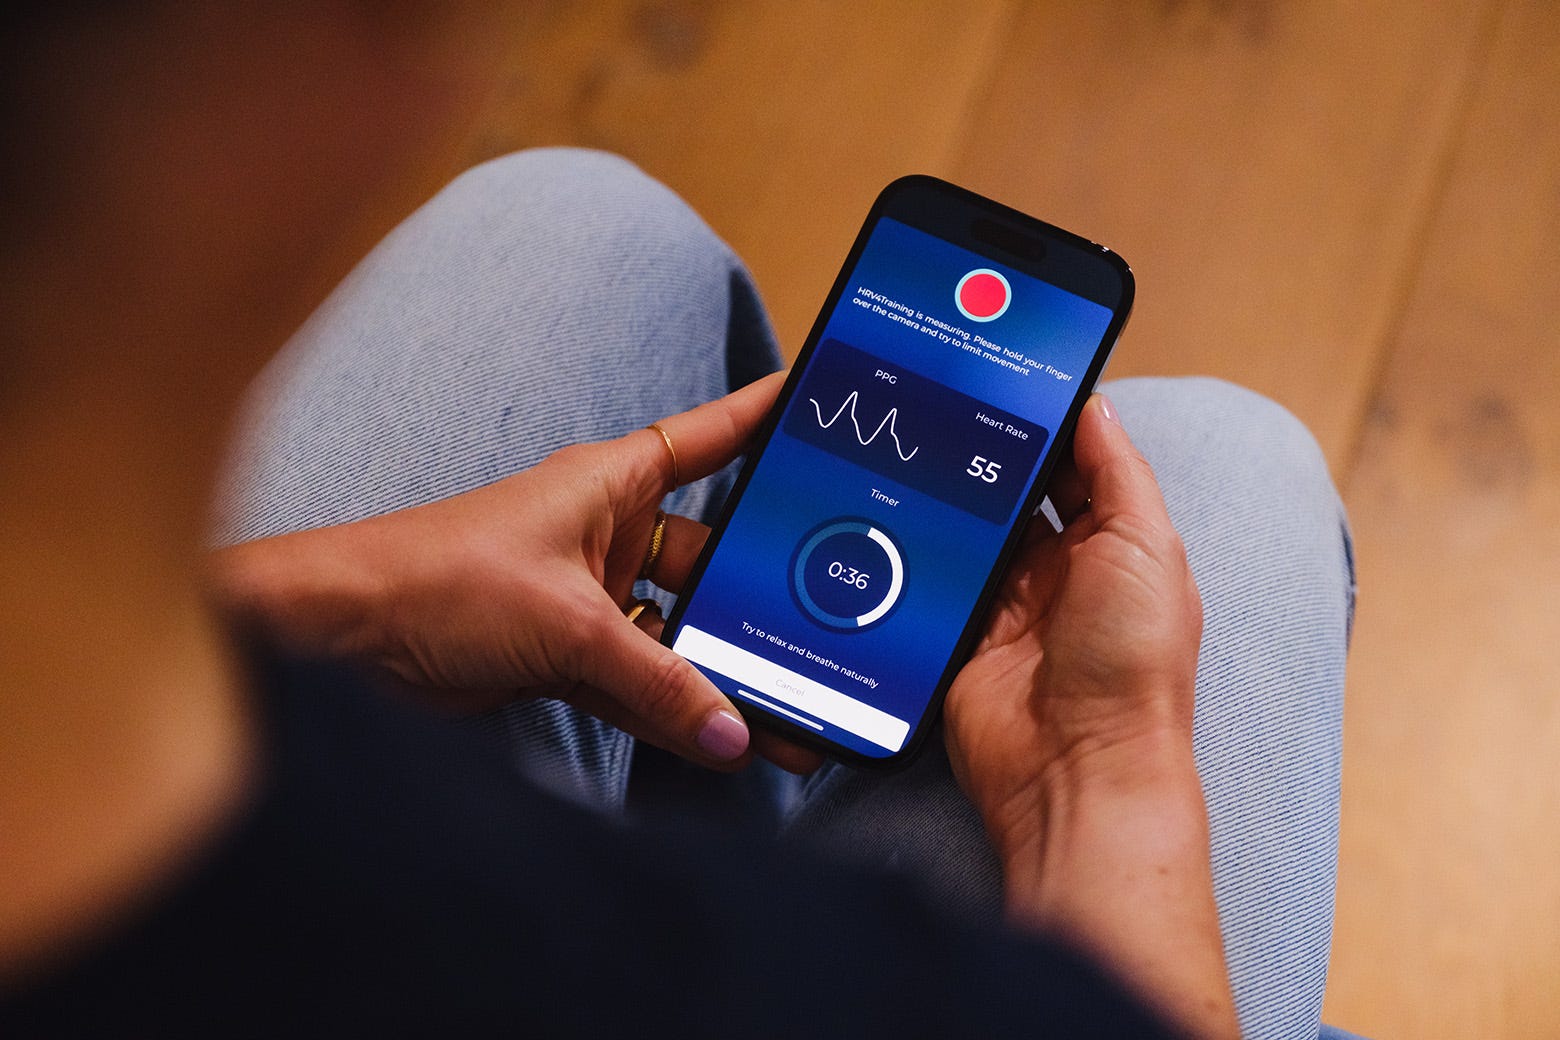
first thing in the morning, while sitting, using the iPhone camera in HRV4Training
Remember an important distinction between:
the actual HRV measurement
the interpretation of that measurement into messages or readiness / recovery scores
Let’s look at some data.
Body position and sensitivity to stress
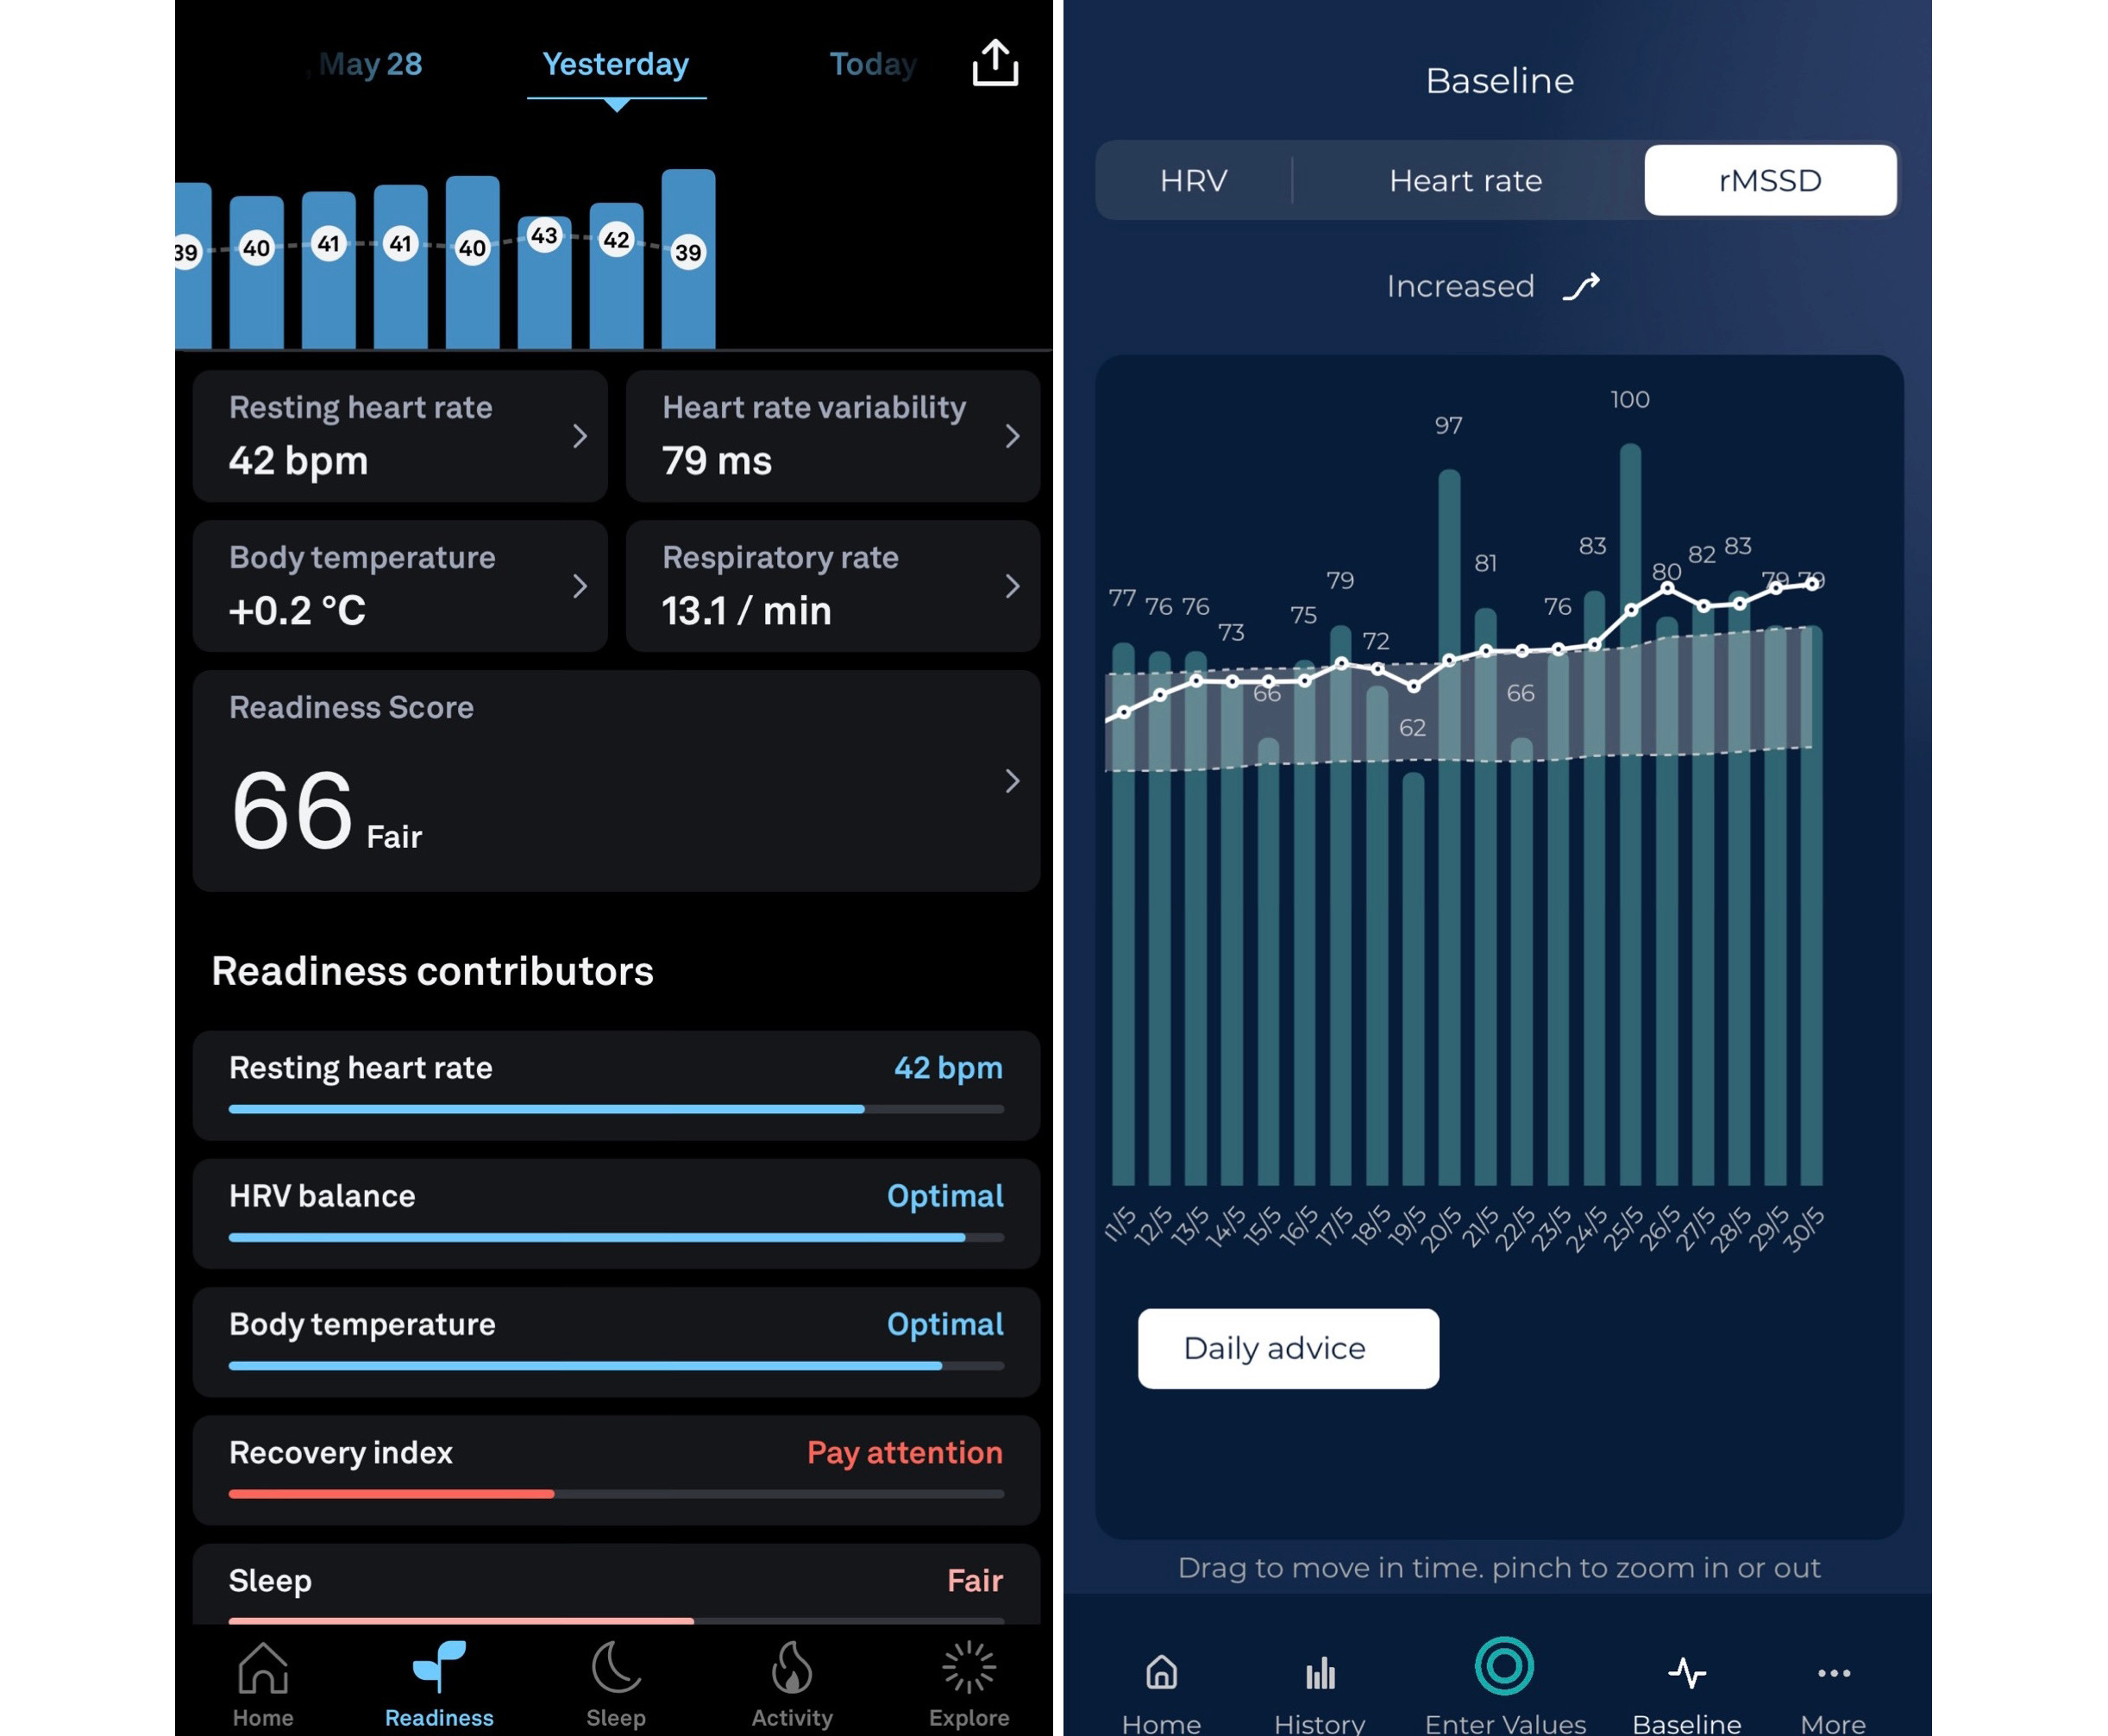
Here is the information I was presented with this morning. On the left, is my morning HRV with respect to my normal range (not good), while on the right is my night HRV incorporated in a readiness score (good).
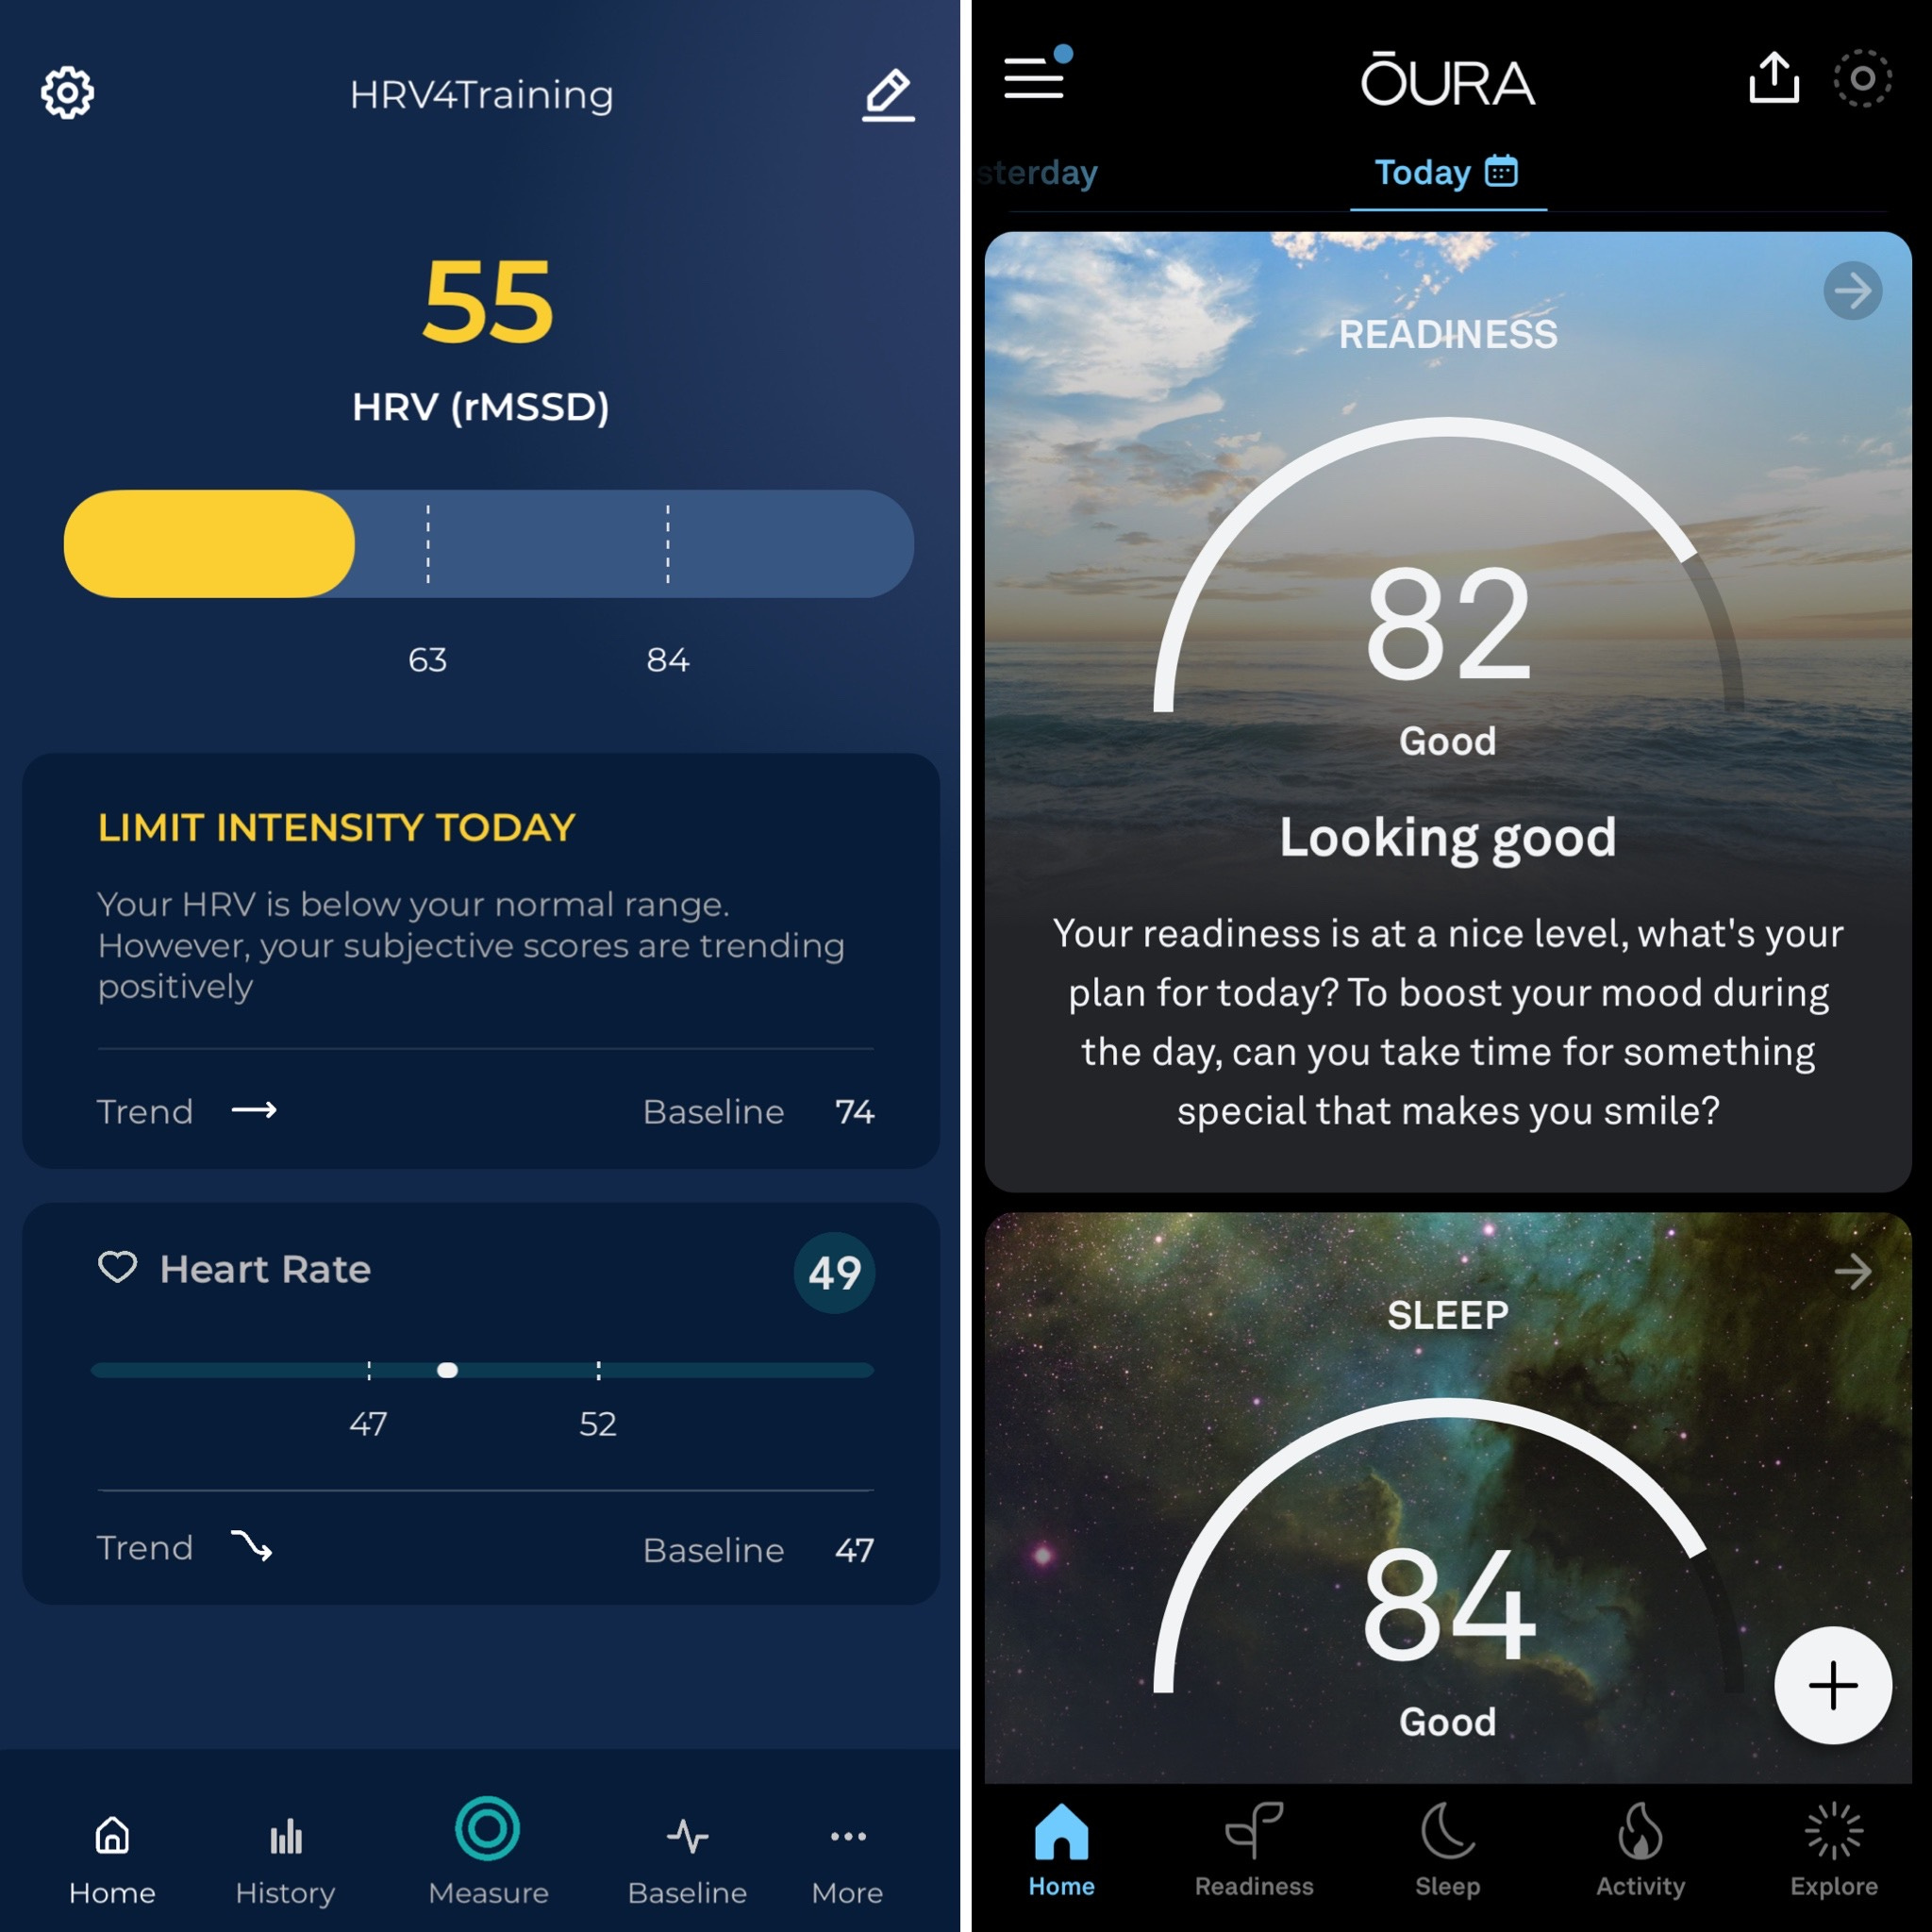
The first thing to do is to look at what the physiology actually says.
We’ll go back to readiness scores later, but first, let’s also read Oura’s data into another HRV4Training app that I use for this purpose so that I can properly contextualize the physiology with respect to my normal range.
On the left, again is my morning HRV captured with HRV4Training, on the right is my night HRV also read in the app:
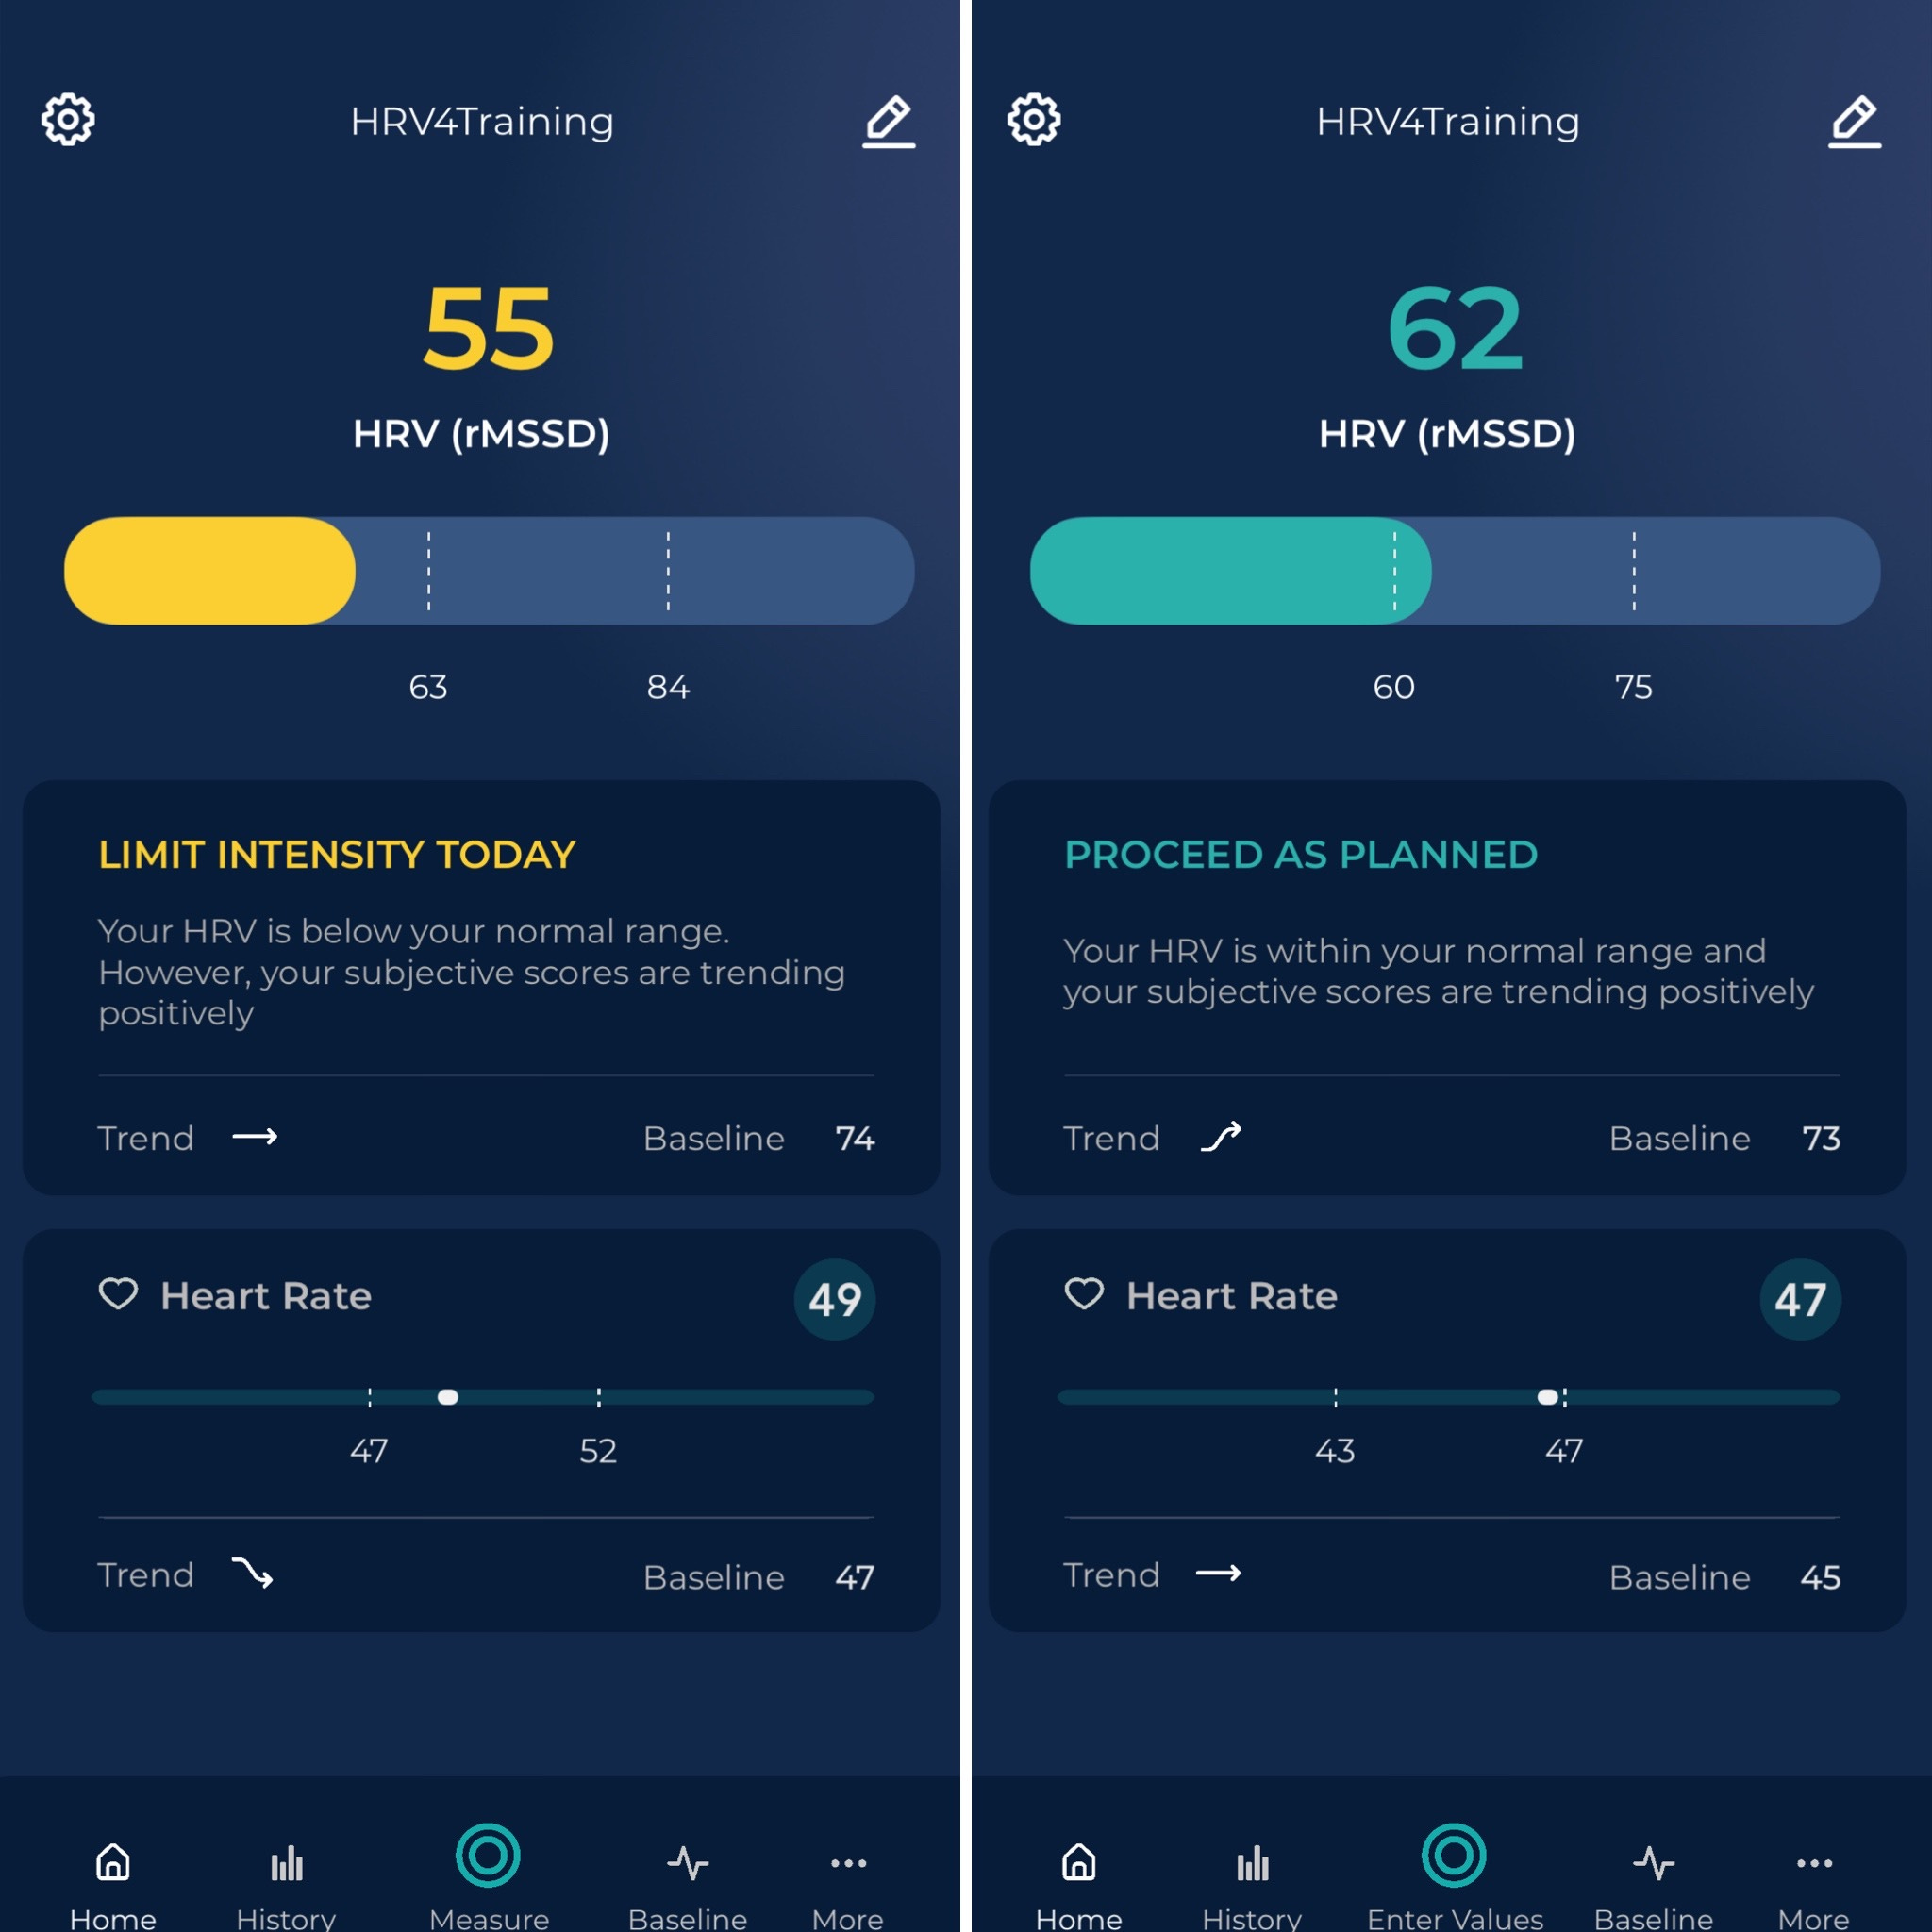
We can now see more clearly that the same “issue” remains, not only my readiness was good, but my night HRV is in fact good or within normal range.
Why is this?
The reason is that measuring HRV in the morning while sitting highlights my stress response: the orthostatic stressor challenges the body and amplifies the response.
On the other hand, complete rest (HRV measured during sleep, a highly parasympathetic state), does not capture these more subtle responses well.
This is why in the context of training, it’s an easy choice for me, and I’d always recommend a morning measurement. Especially for athletes, who might have quite high resting parasympathetic activity, sitting is probably the way to go.
see also:
Short term vs long term
These situations, cause discrepancies but impact much more the data in the short term, acutely, than in the long term.
If your lifestyle is similar to mine (dinner at 7 pm, bed at 10 pm, no alcohol, no children), then your night and morning data will still look very similar in the long term, as you can see in the past few months of my data:
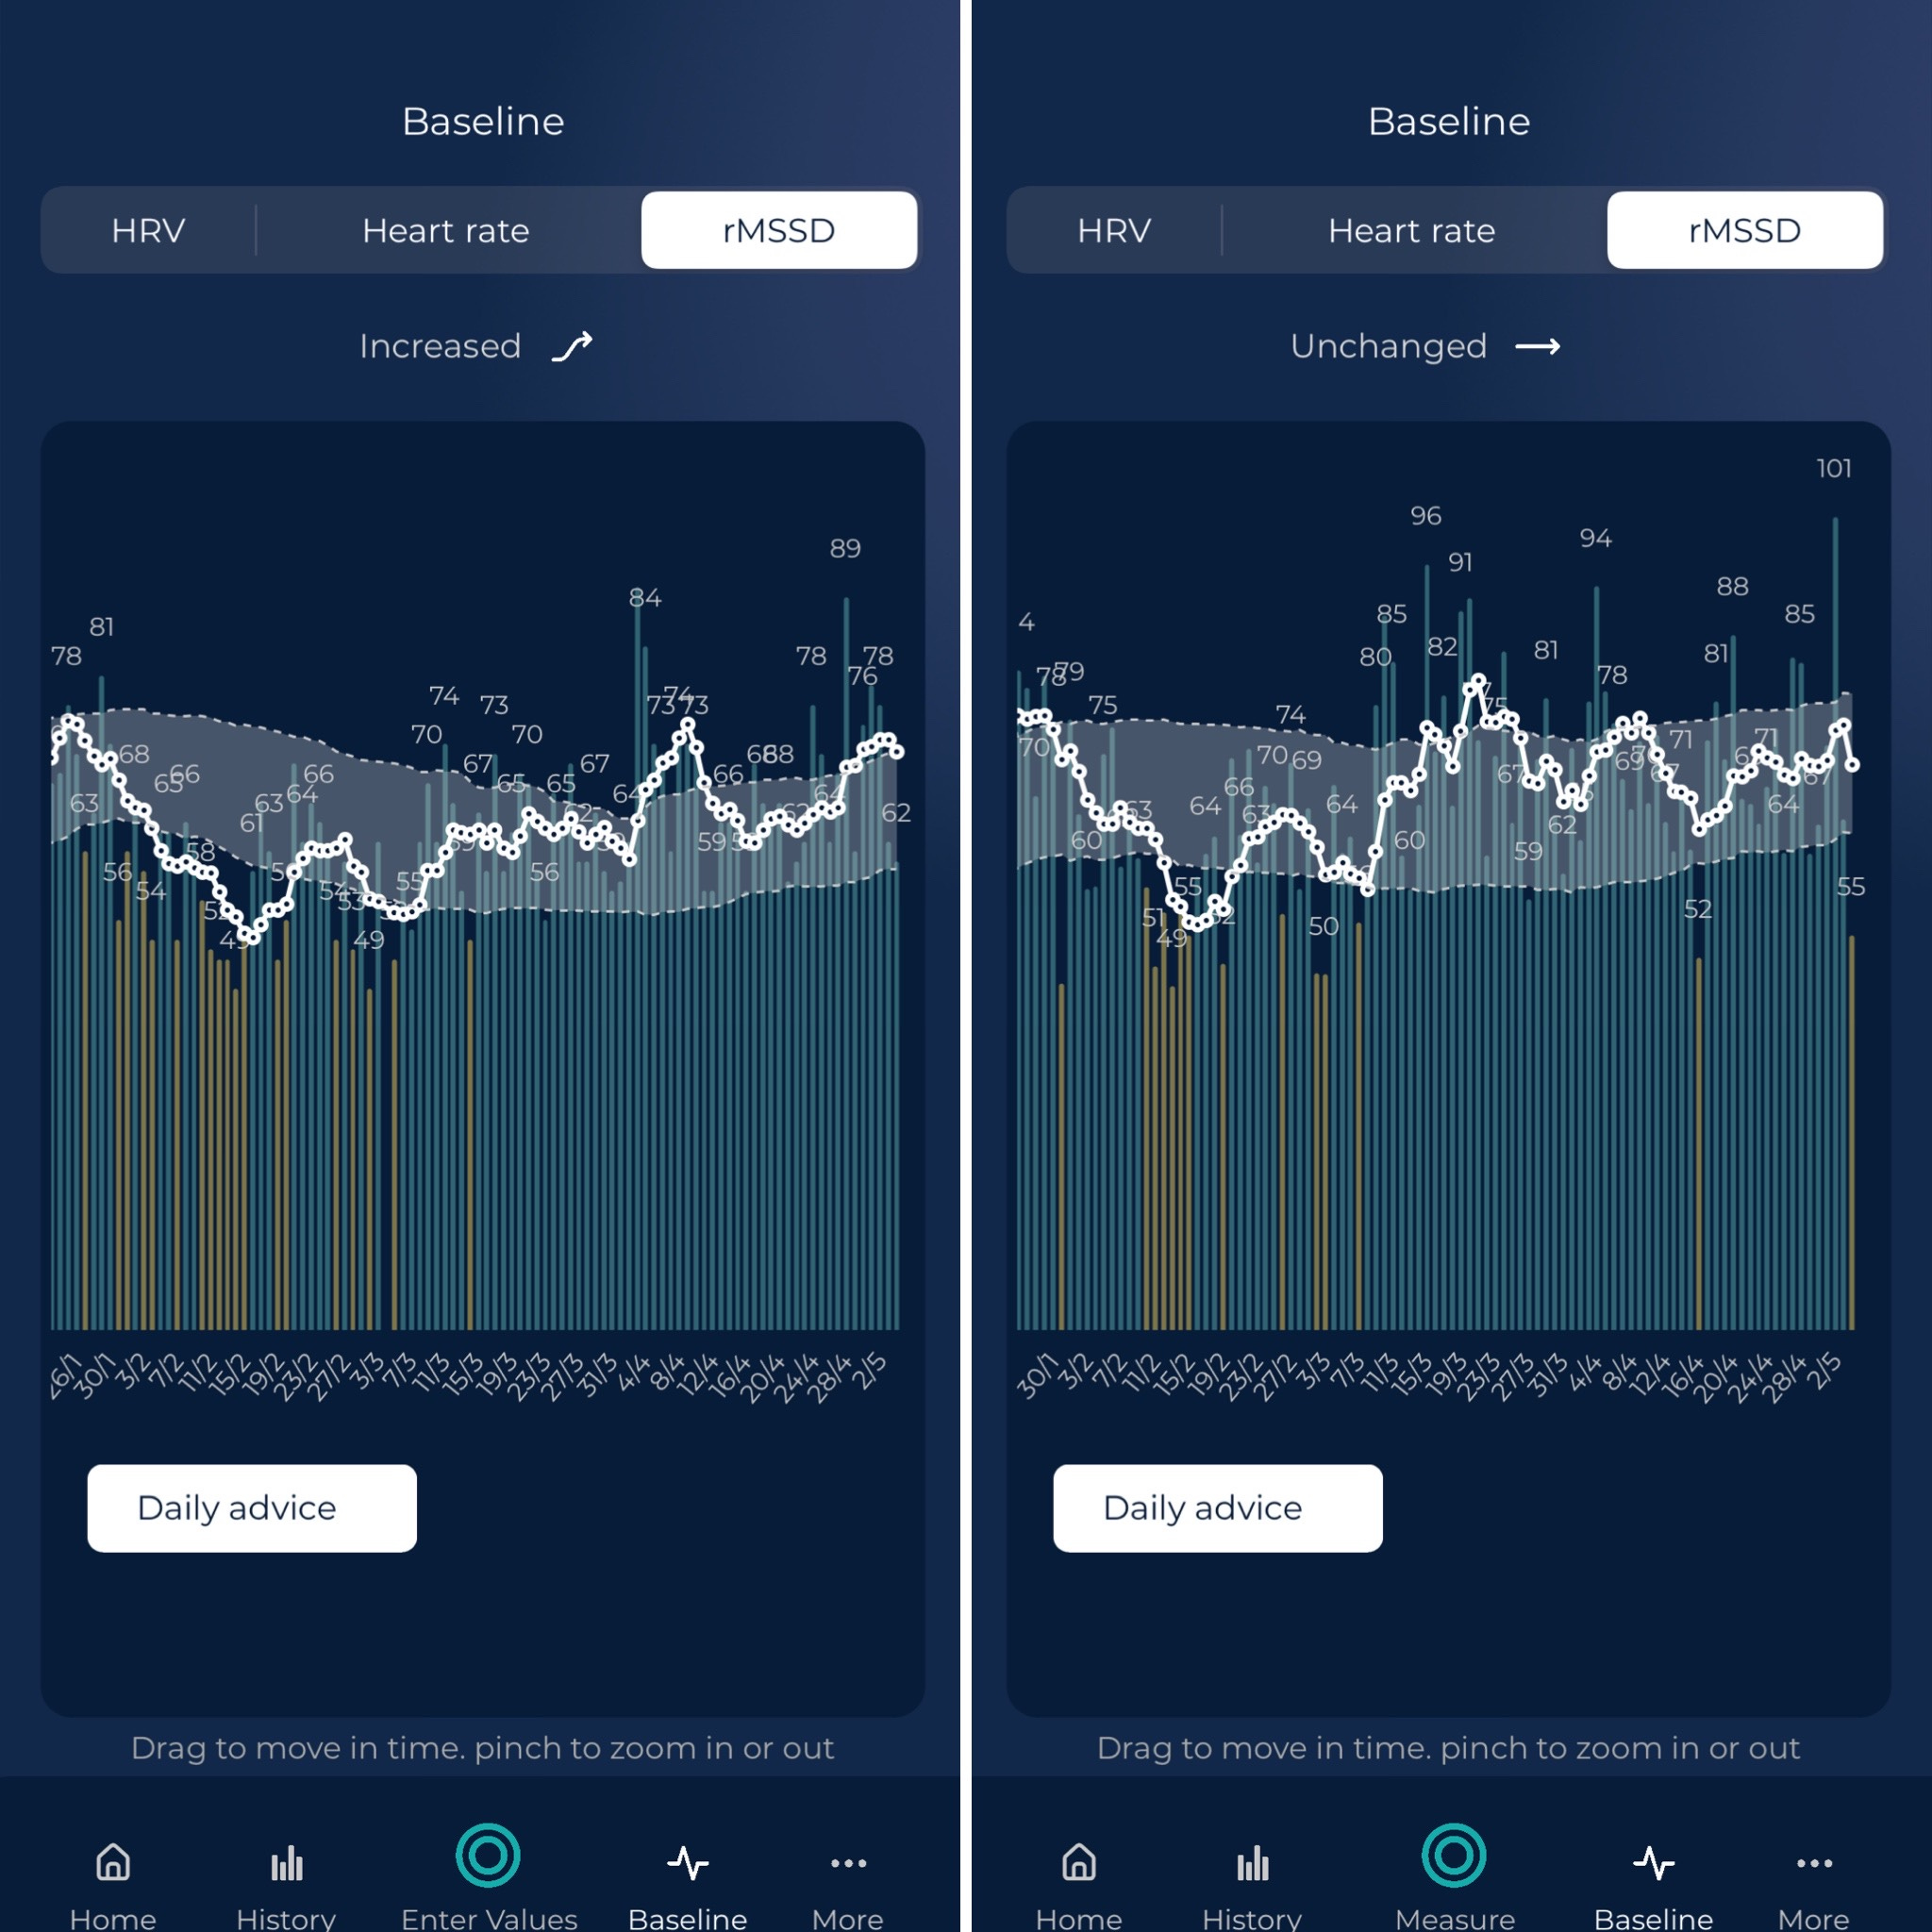
Above you can see my night data (left) and morning data (right). In February I had some health issues, captured well by both protocols (sustained suppression in HRV with the baseline going below the normal range). Then, I rebounded a bit and went back down with an injury at the beginning of March. The past month and a half have been good, stable, and trending high.
We are looking at resting physiology from different angles, but it is still resting physiology, and as such, if the data and the protocols are good quality, the data will be similar.
However, if we zoom in at times of higher physical stress, night data misses the mark. I had two situations here post hard marathon (April 17th) and post long run (yesterday), in which this is quite clear:
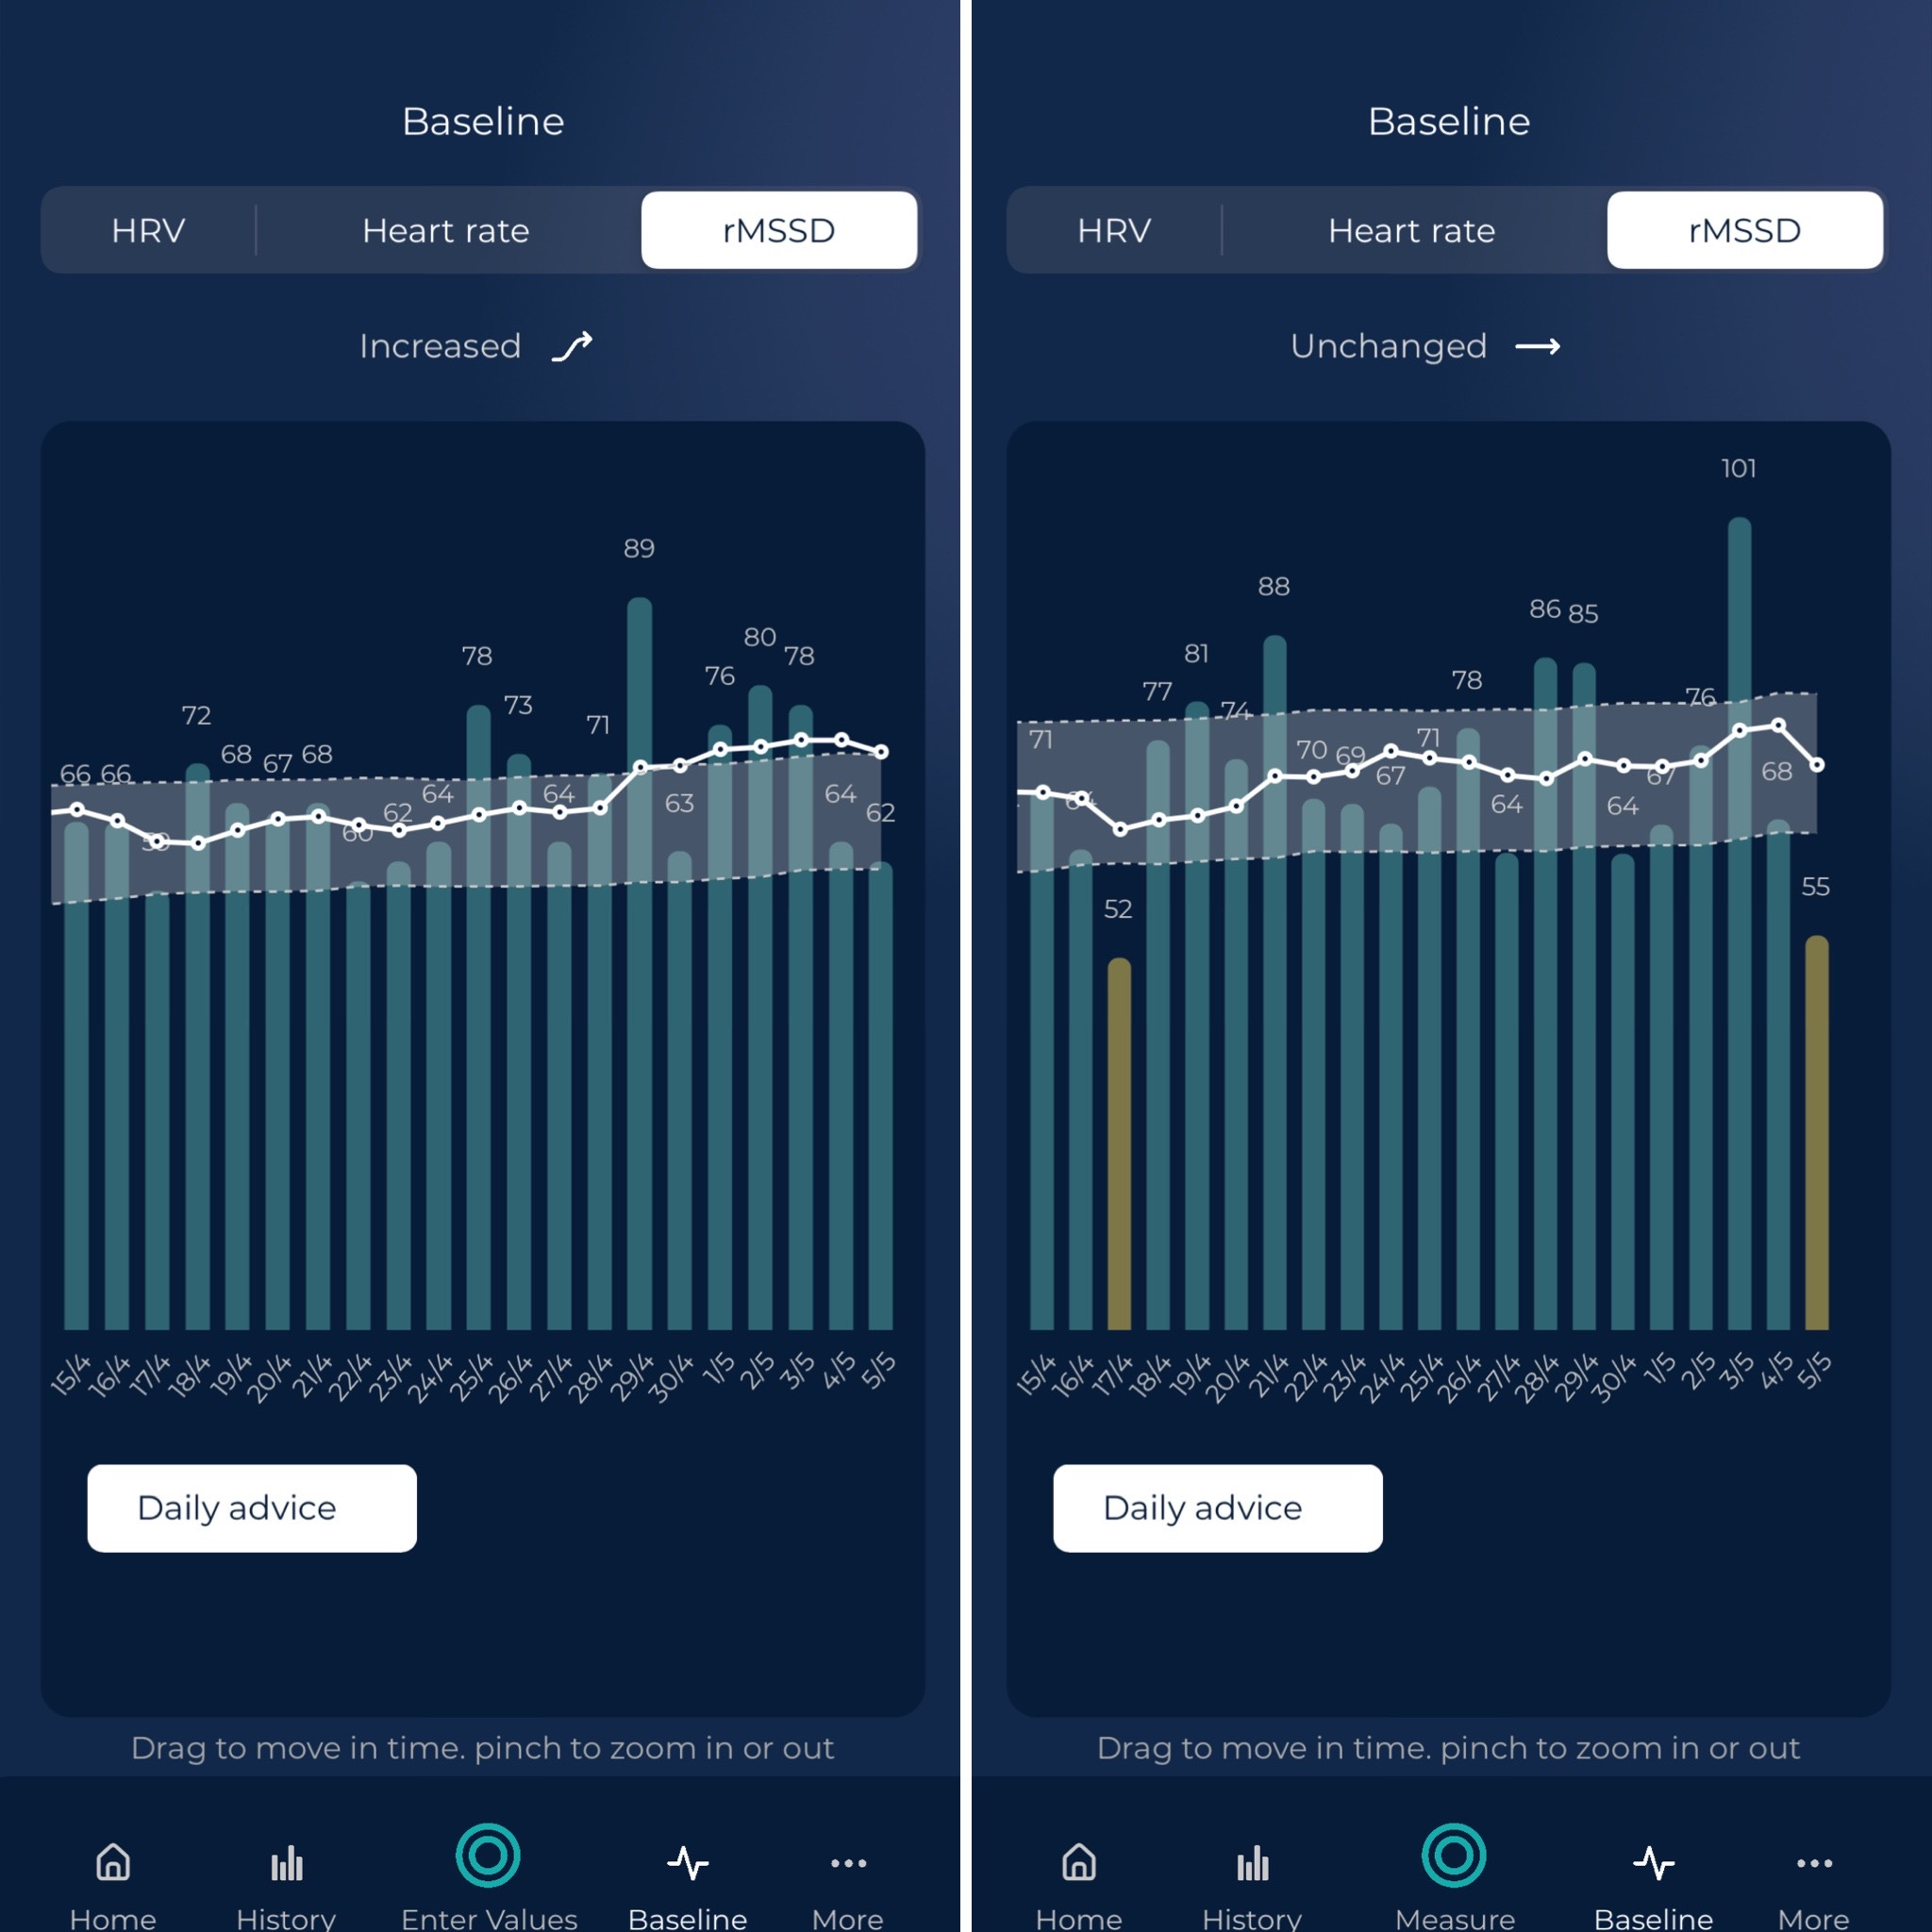
Again, night data is in the left pic, and morning data is in the right pic. Higher stress is captured better when sitting up in the morning, despite the fact that more time has passed since the stressor.
Night data is not incorrect, and is also informative: it tells me that right now I am fit and can recover fast from very hard efforts. When less fit it might take me several days to bounce back from these efforts, a response that is visible also when measuring in a highly parasympathetic state (night data).
Additionally, seeing my heart rate within my normal range for both measurements also tells me that things are looking good, and most likely HRV while sitting will also be back to normal tomorrow.
It all makes sense if we understand the physiology and technology.
See also:
Readiness scores
At this point, we have established that morning and night data differ, and that the orthostatic stressor (sitting or standing in the morning) makes the data more useful for the purpose of tracking training responses.
We have also seen how these acute differences are less visible when looking at the data long term, and both methods can track long-term changes in very similar ways.
This is why a device that measures in the night can be a good tool to monitor health or long-term changes while taking a measurement in the morning is probably better for day-to-day actionability. Very large acute stressors will also be visible in night data of course (e.g. excessive alcohol intake, an internet’s favorite - but hopefully, that’s not the only insight you get from your wearable).
Either way, my recommendation would be to always look at the physiology, and not bother much with scores built on top of the metrics, for reasons I discuss in more detail here. Scores make assumptions: you exercise more or sleep less and you are penalized. However, your physiology might be perfectly normal, and that’s what you want to look at, especially in the context of training. Learn to look at the actual data and to use tools that allow you to easily understand if a daily measurement is within your normal range or not.
Yesterday I slept more than normal and without interruptions, which contributes to a higher readiness score. That’s great and might be useful information in general, but when it comes to training, I need to know where my physiology is, without the confounding effect of my behavior.
I often hear from people using e.g. an Oura ring, a Whoop, and a Garmin, all at the same time, that they find the data inconsistent. However, the data is in fact the same, if you know where to look (i.e. the actual physiology) and ignore made-up scores (readiness, recovery, etc.). I have tested all of them against ECG (full blog here), and these devices are now equally good at tracking relative changes in night HRV over time.
It’s fine if you prefer to go that way and not actively measure, but understand the limitations and caveats.
Here is a final example, where the opposite happened: big weeks of training and average sleep give me a 66 readiness, which is as bad as it gets. However, my physiology shows an ideal response: I cannot be any better. As athletes, wearables can be helpful, but you need to understand how to use the data.
Readiness or recovery scores aim at guiding you reactively, in the absence of a plan. While this might make sense for lifestyle, it makes no sense for training. When you do have a plan, look only at the physiology, as the physiology tells you how you are responding, and if changes are needed.
What does the research say?
In a recent study researchers looked at self-reported stress measures (collected via a validated questionnaire), in relation to physiological measurements (e.g. resting heart rate and HRV) and made-up scores (the recovery score provided by a wearable).
As expected, we had a negative correlation between self-reported stress measures and HRV, i.e. the higher the stress, the lower the HRV. Similarly, we had a positive correlation between resting heart rate and HRV, hence the higher the stress, the higher the resting heart rate. The relationship between HRV and stress was also somewhat stronger than the relationship between heart rate and stress, highlighting once again how HRV is probably a more sensitive marker of stress. So far so good.
How about the recovery score? There was zero correlation between the recovery score and all other variables. This is quite something, I am not sure I’d be able to design a score that ends up being as useless as this one, even if I wanted to.
Please do yourself a favor: if you want to use a wearable, at least use it to look at the physiology, and ignore made-up metrics (recovery, readiness, etc.).

Start with a plan and don’t be too reactive
Wearables promote a very reactive approach, typically based on blind guidance.
You are often prompted to react based on made-up, cumulative scores (readiness, recovery, stress, etc.), with little focus on the long-term picture.
Most importantly, you are not adjusting a plan, you are making it up as you go: that's not how you improve your health or performance.
The made-up score is low? you need rest. The made-up score is high? go smash it.
Simplistic, inaccurate, and overly reactive.
In my opinion, there is a better way of using the data we can collect:
Start with a plan.
Assess how you are responding (your actual physiology: heart rate, HRV, etc., forget about made-up scores). Ideally, log how you subjectively feel as well.
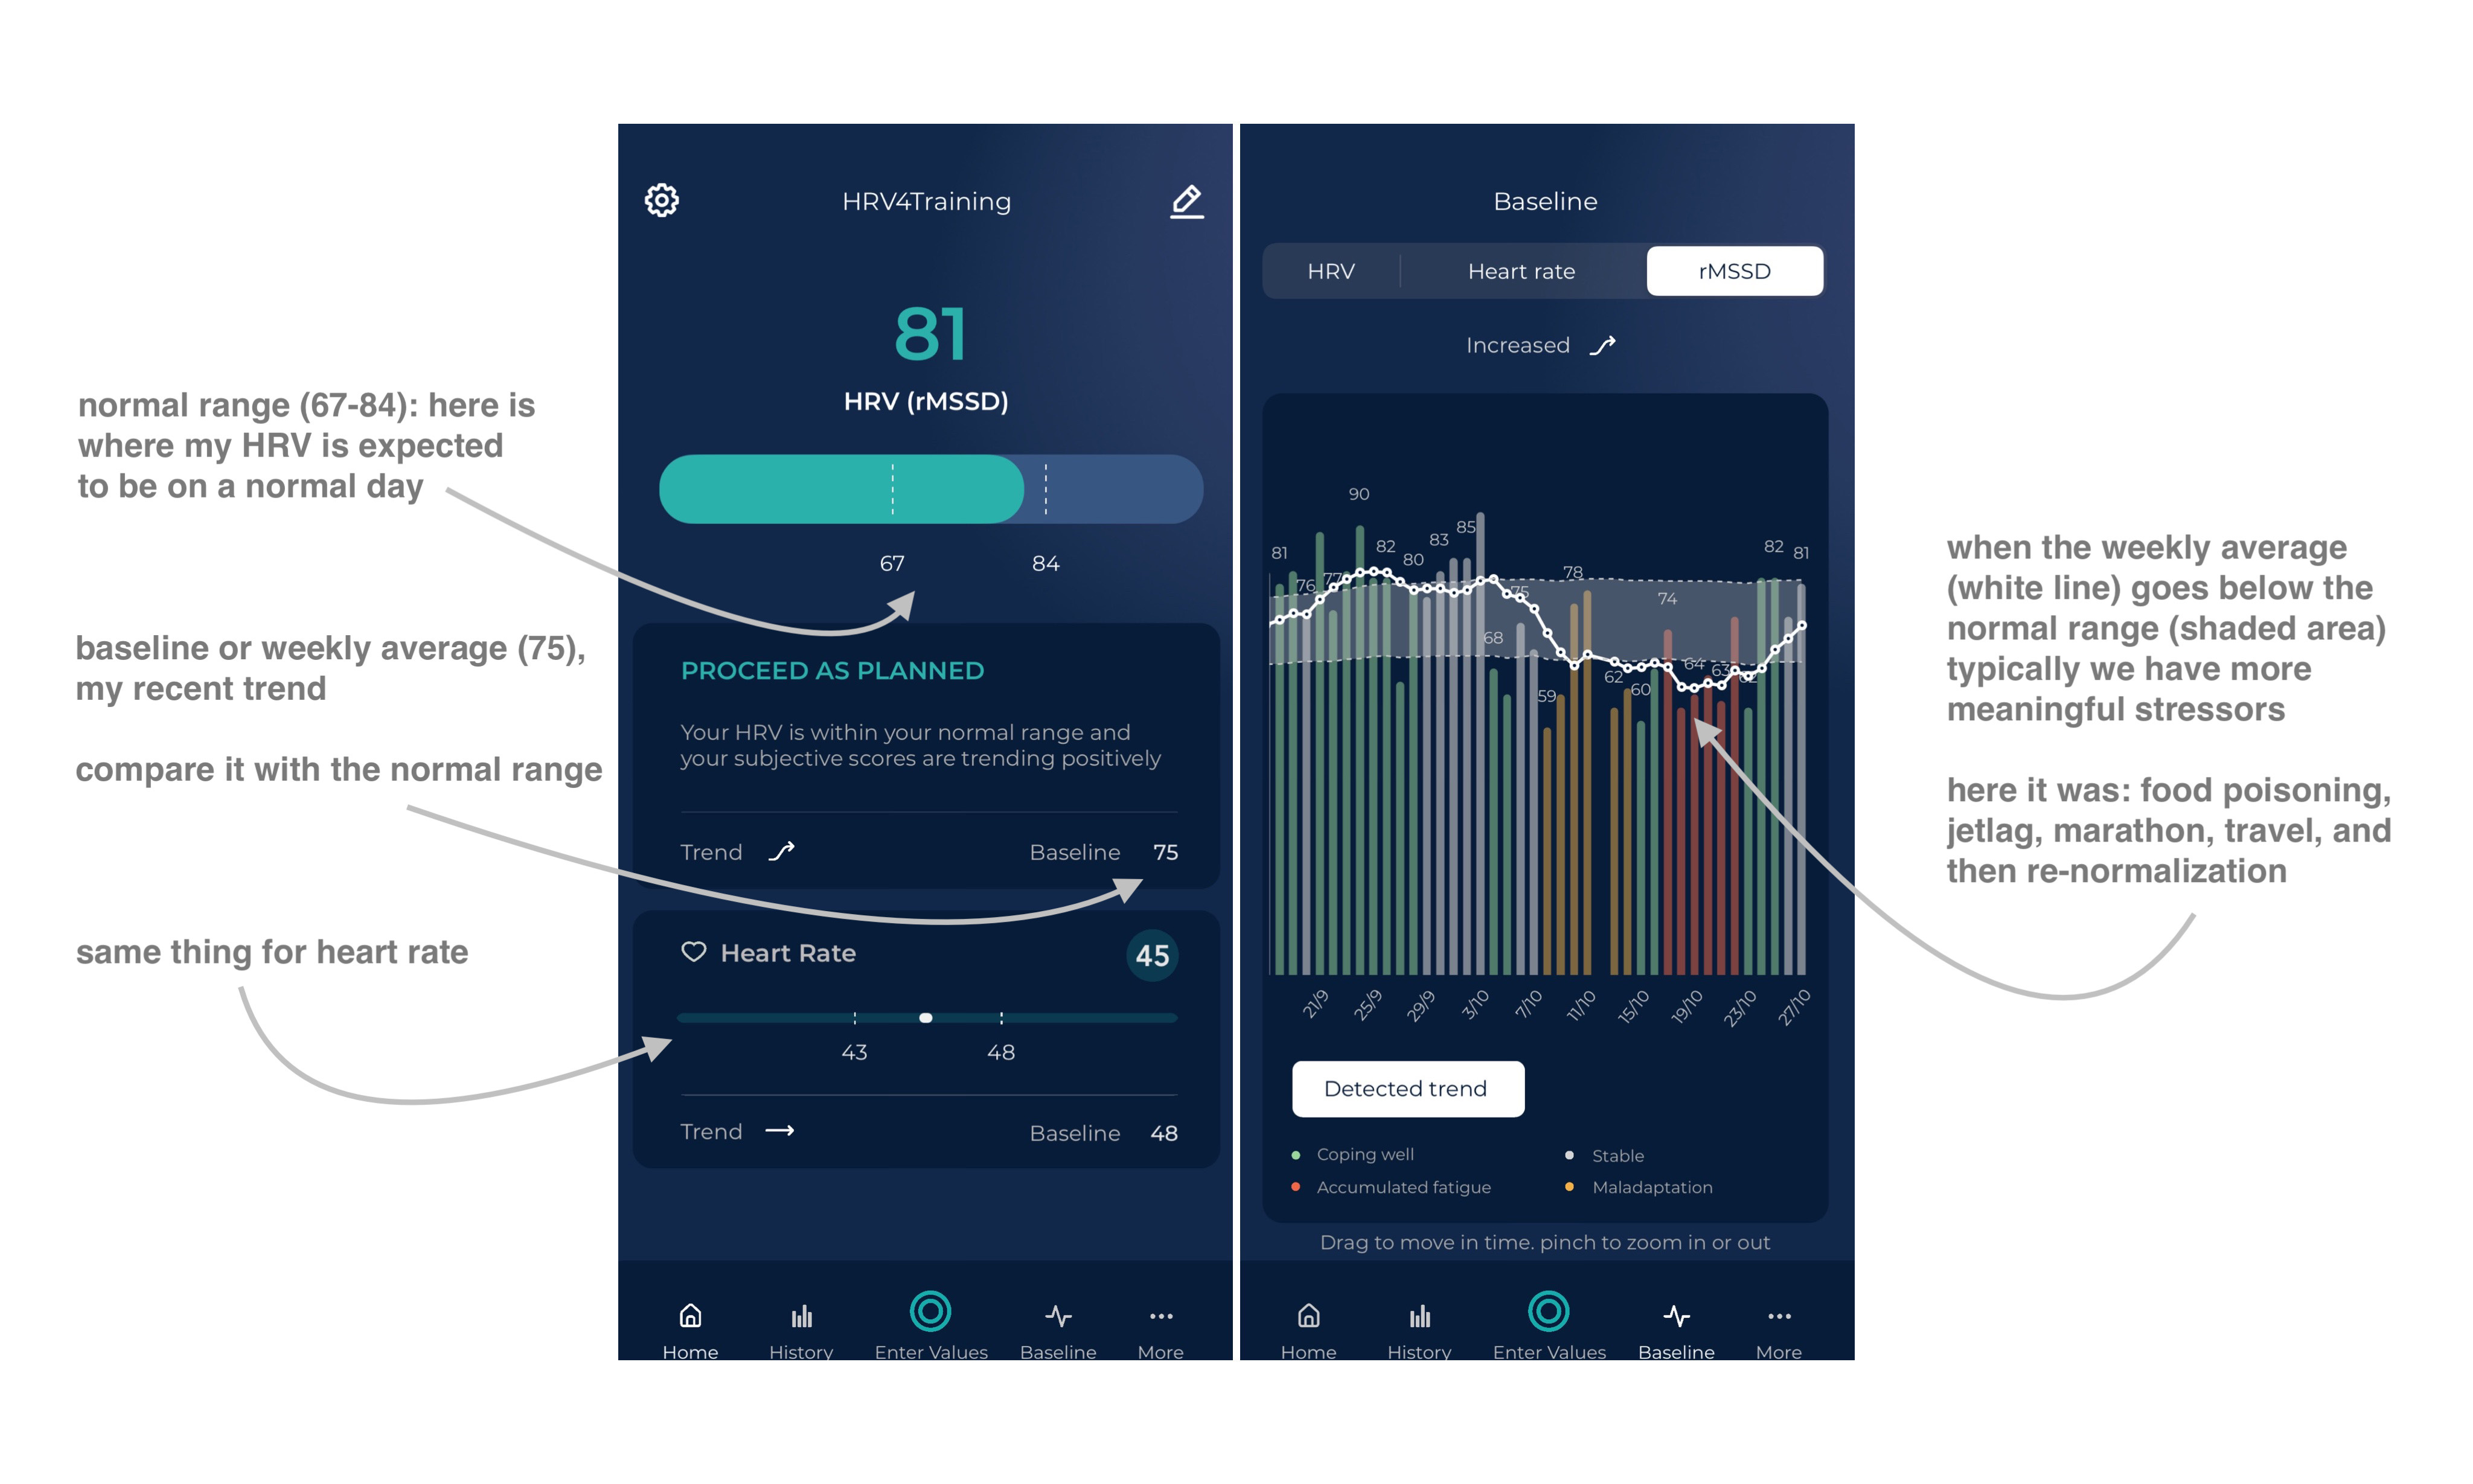
As you collect more data, focus less on acute or day-to-day changes, and start looking at longer-term changes, e.g. your baseline or weekly average with respect to your normal range (or 1-2 months of history), see below for an example.
There is always day-to-day variability in any metric, but most of the changes have little or no value. This is why it is key to contextualize daily values with respect to our normal range: on most occasions, things are just normal, and no particular changes are required.
Once you are able to identify meaningful changes in your resting physiology (i.e. changes outside of your normal range), start taking note of how physiological changes reflect your short and long-term choices (training, lifestyle) as well as environmental factors (climate, season) and other events (e.g. sickness).
Only then, potentially make small adjustments and see if your physiology is more stable (for HRV, fewer dips or swings in morning or possibly night measurements is a good sign, even when there is no increase over time in the metric).
Most importantly, see how health and performance outcomes are impacted: the metrics might help you in getting there, but should not be the sole focus.
Don’t be too reactive. Identify rare, meaningful changes.
Good tools are boring.
I hope this was informative, and thank you for reading!

Marco holds a PhD cum laude in applied machine learning, a M.Sc. cum laude in computer science engineering, and a M.Sc. cum laude in human movement sciences and high-performance coaching.
He has published more than 50 papers and patents at the intersection between physiology, health, technology, and human performance.
He is co-founder of HRV4Training, advisor at Oura, guest lecturer at VU Amsterdam, and editor for IEEE Pervasive Computing Magazine. He loves running.
Social:
Hello, thank you for the article. How do you measure with HRV4 Training at night? Thank you.
After the first images you changed the left/right (morning/night), which confused me for a second. Anyway, great post as usual.