Heart rate variability (HRV) analysis before and after exercise
Tutorial and examples
Recently I have been experimenting again with pre and post-exercise HRV measurements. In this blog, I cover the rationale, tools, and protocols used, in case you are interested in looking into this as well.
We’ll also look at some data I’ve collected and see how it relates to published literature
But first thing first: why would we want to measure HRV before and after exercise?
Rationale
Based on Stephen Seiler's research, using pre and post-exercise HRV we can better understand the impact of different workouts. In turn, this might help us fine-tune exercise intensity or duration, e.g. to make sure we are not overdoing it on our easy days.
By measuring autonomic activity (heart rate, HRV) immediately before and after the workout, we isolate the training stressor in a way that allows us to answer different questions, for example, the following ones come to mind:
is our easy training really easy?
at what intensity does a workout require a much longer recovery time?
does it need to be hard? what about just a bit harder than "aerobic threshold"?
and what about duration? at what point an easy run becomes harder to recover from, in terms of duration?
Below we can see some data from the research in question, showing heart rate and HRV (rMSSD) in the hours after exercise of different intensities (full text of the paper, here).
Interestingly, the response seems quite binary, despite the stimulus provided covering the full range.
For example, we have easy efforts of different durations, below the first ventilatory threshold (VT1), then a moderate intensity effort between thresholds, and then another hard effort above the second ventilatory threshold (VT2).
However, the response, shows that easy efforts are not causing any disruption in HRV, which is the same as before training. In contrast, moderate and hard efforts, above the first ventilatory thresholds, all cause a large, similar suppression. This is quite in line with how I see training, either we are going easy, or we are going hard (and hard includes anything above the aerobic threshold, as that intensity is simply not easy anymore, regardless of how we want to call it: tempo, steady, zone 3, etc.).
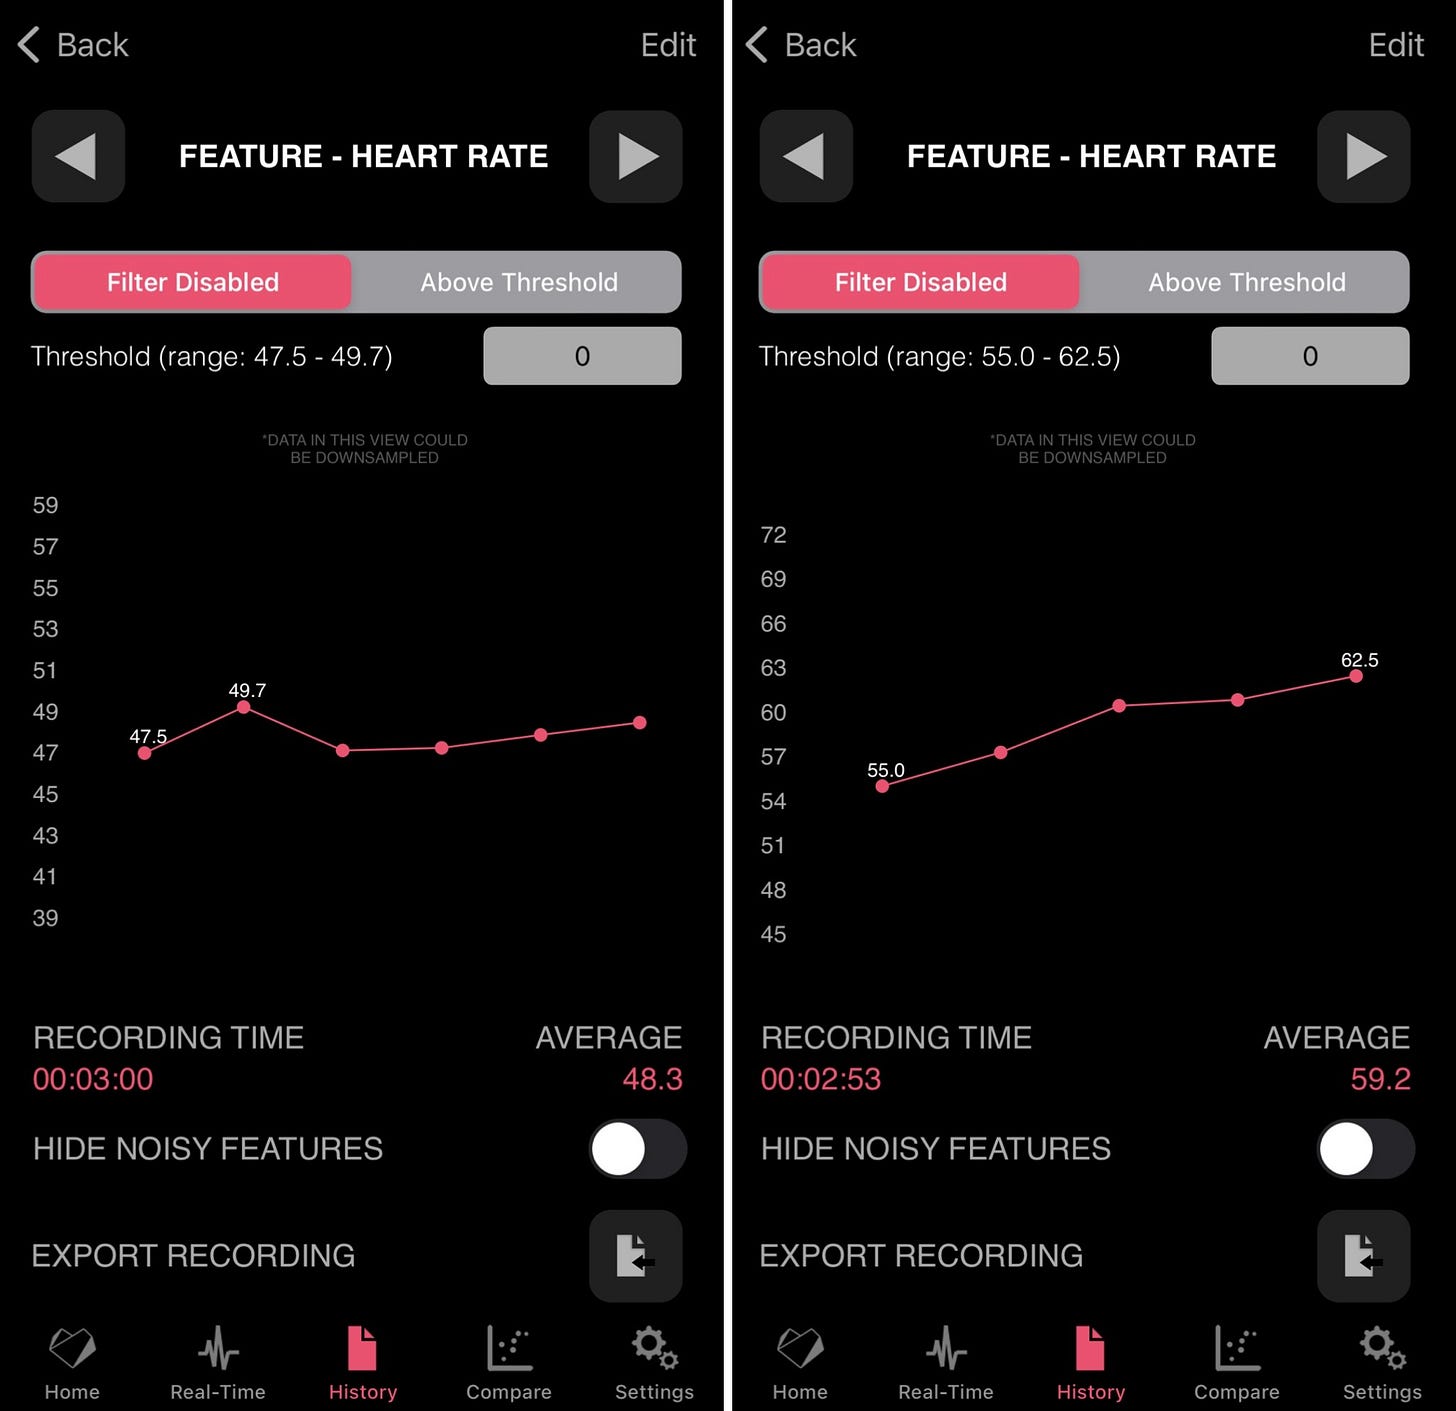
We can also see how HRV is the same or higher for easy efforts, while heart rate remains always slightly elevated, this is something I’ve also seen consistently in my data (see below), highlighting important differences between heart rate and HRV in terms of how they reflect autonomic control and recovery.
Tools
For the data presented here, I used the Heart Rate Variability Logger (that I make, and that you can find here), linked to a Polar H10 chest strap.
The configuration that I use for the HRV Logger is the following:
features computation window: 30 seconds
RR-interval correction: 25%
This way we get a heart rate and rMSSD value every 30 seconds, and the app takes care of removing outliers that could be due to either the strap malfunctioning or actual ectopic beats.
Data collection protocol
The protocols used in the original paper are not the most practical to replicate in real life (we are not going to wait 4 hours post-workout, without eating or showering). However, it seems that most of the useful information is captured in the first 5 minutes already, so I’d recommend that, as a starting point.
My protocol is the following:
before exercise: I wear a Polar H10, link it to the HRV Logger, and measure for 2-3 minutes.
after exercise: same as above, Polar H10 and HRV Logger, then measuring for 2-3 minutes after an easy run or maybe stretching it to 10 minutes if I did a hard session and I want to try to capture some re-normalization, as opposed to just the suppression.
Since these measurements are quite short, I make sure not to talk and also try not to drink (even though I might be drinking during training). Note that other things mess up the data quickly: swallowing, for example, is problematic for HRV. If it happens, just measure a little longer and ignore the rMSSD for that 30 seconds window.
In terms of breathing, keep it relaxed, similar to what we do for morning measurements.
Let’s look at some data
Low-intensity training
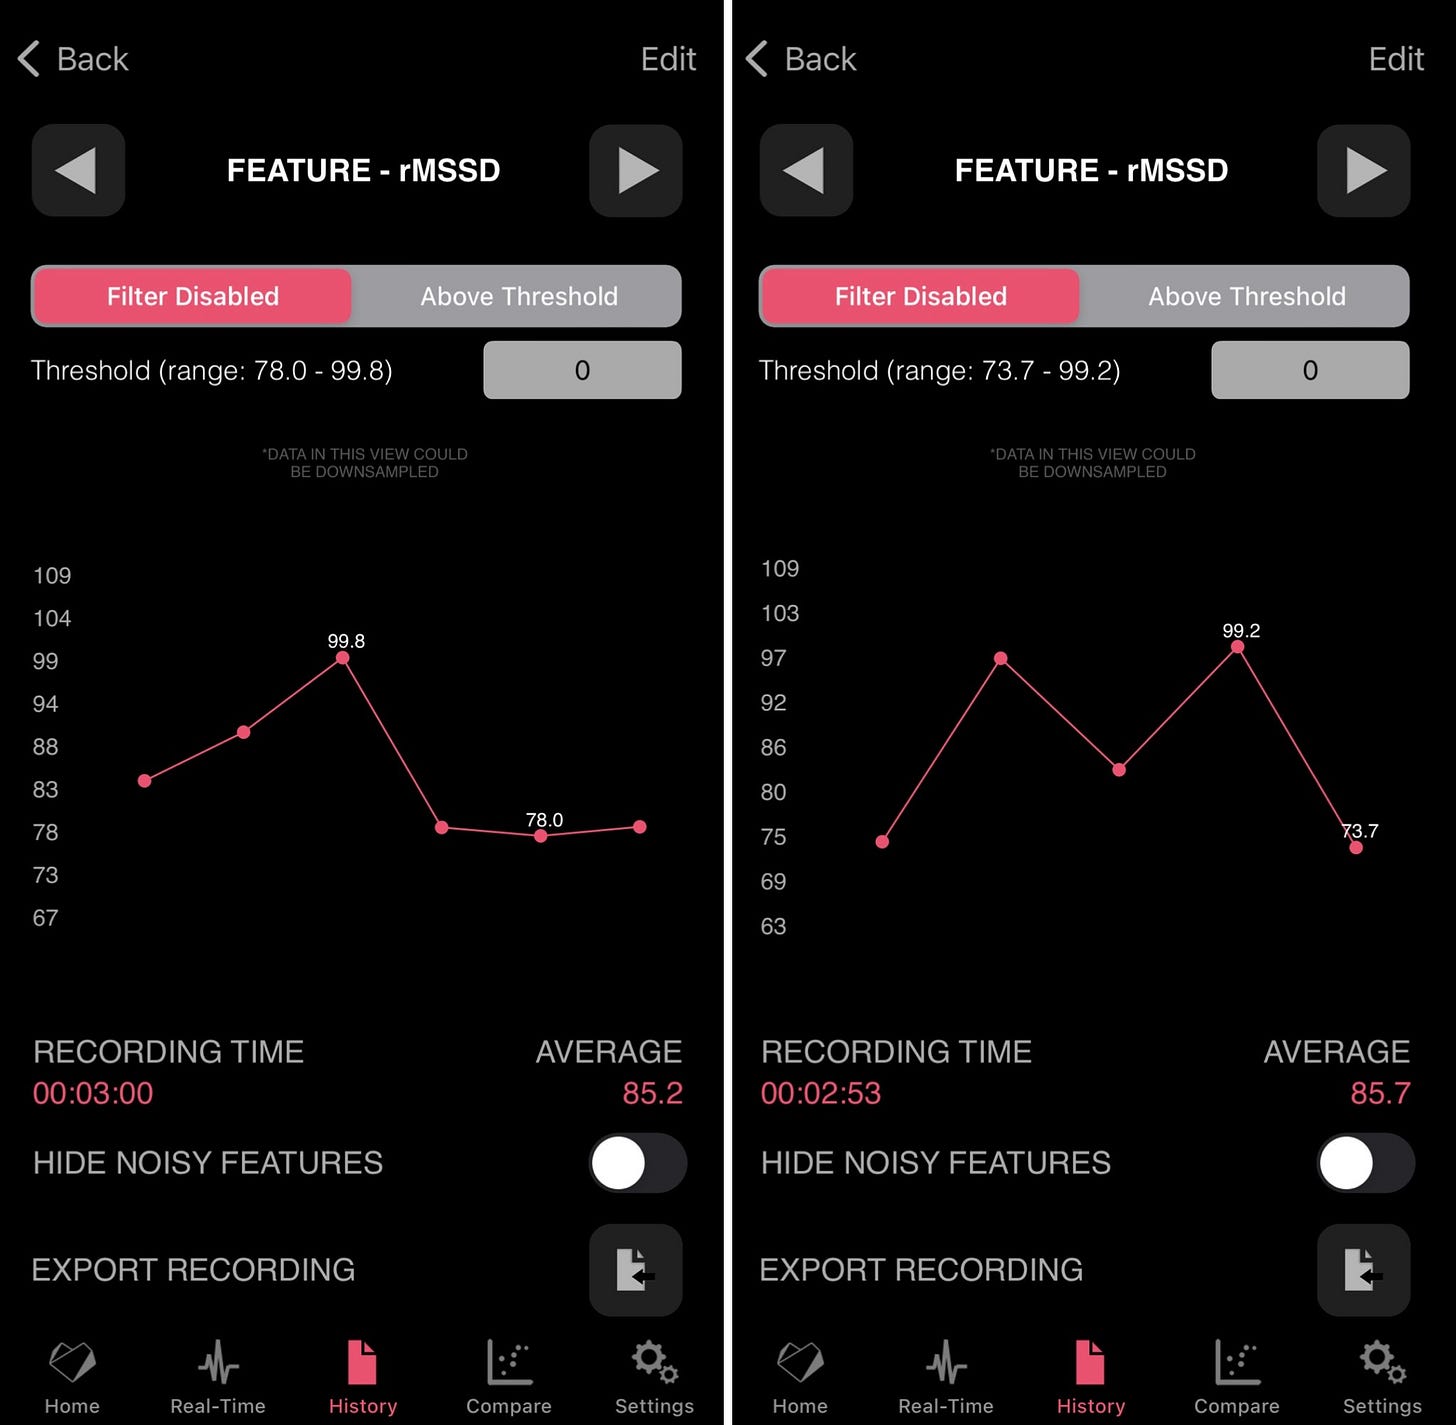
Let's start with rMSSD before and after an easy run of about 2 hours:
In this case, the relative intensity was quite low (116 bpm or 62% of my maximal heart rate), and rMSSD is indeed the same as before exercise. We can however see how heart rate is not completely re-normalized, similar to what we have in Stephen’s paper:
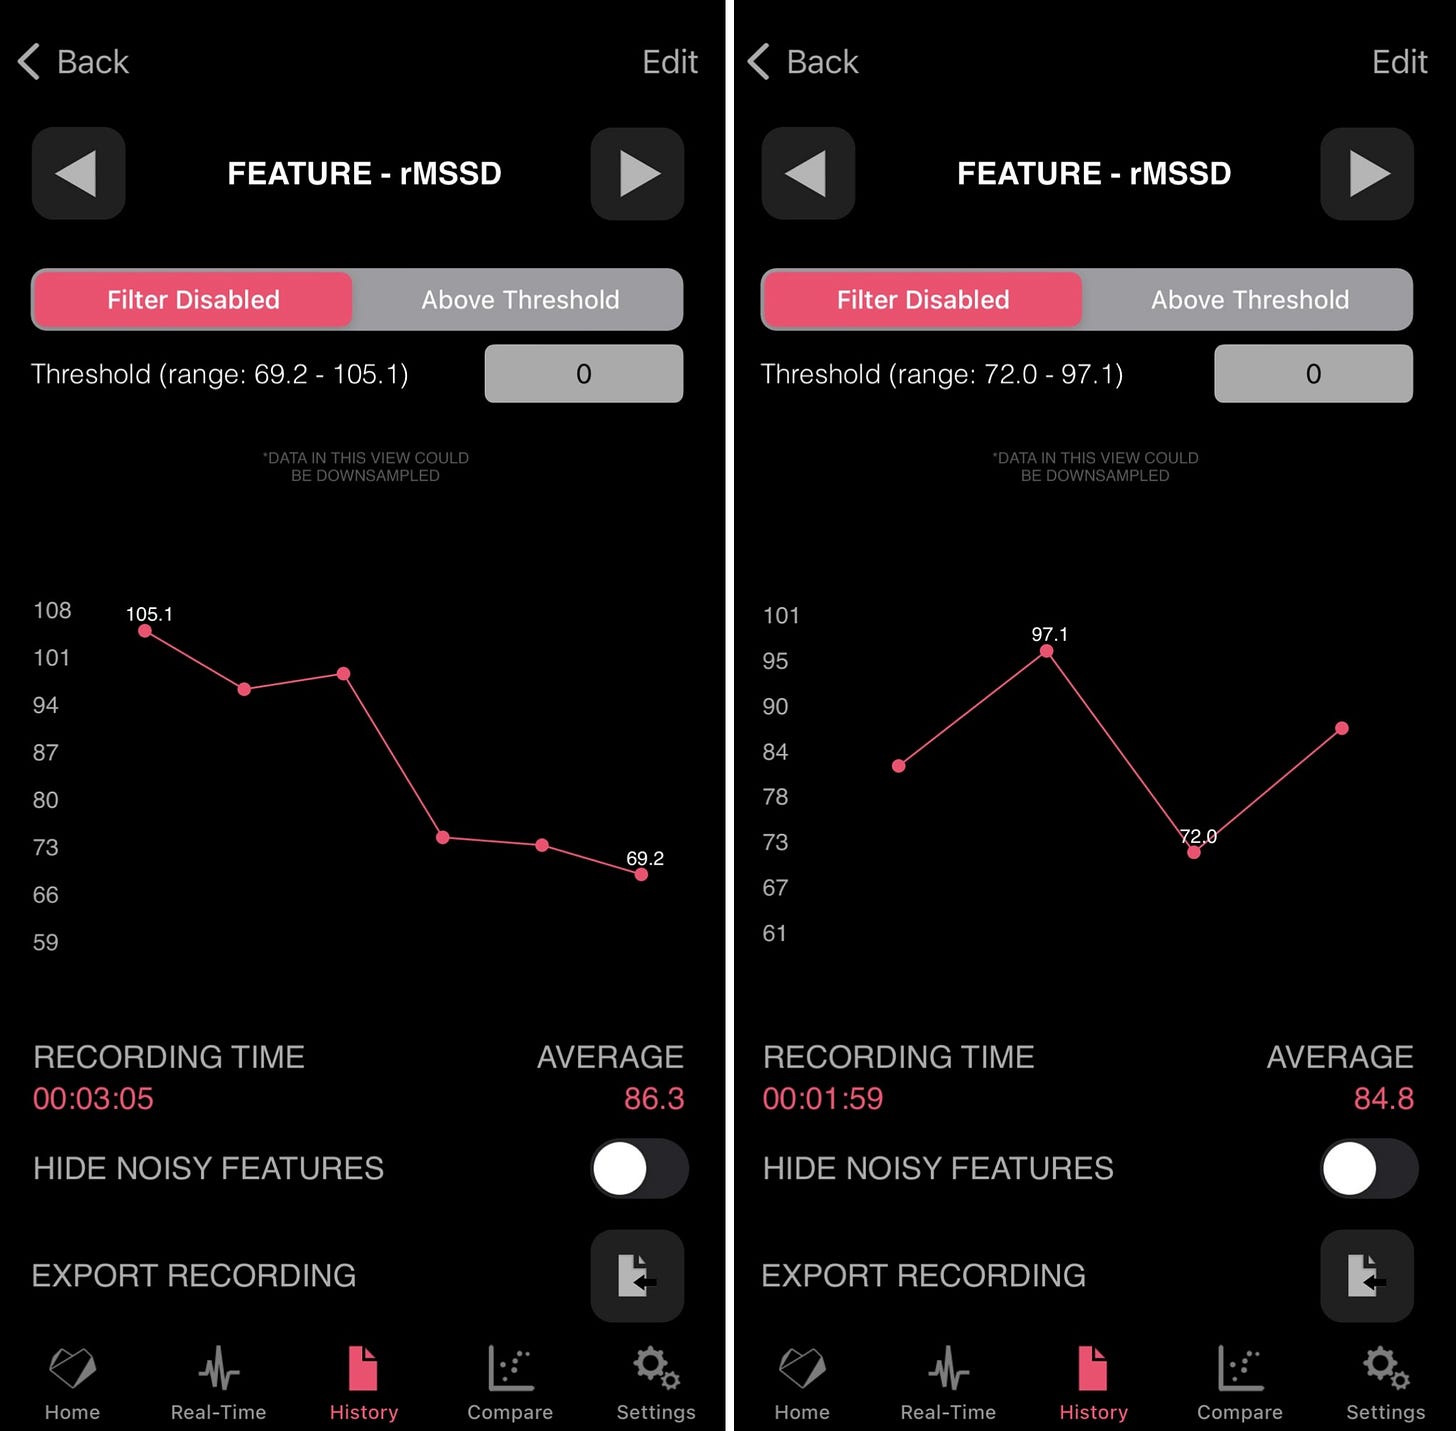
I’ve done plenty of these pre-post measurements and easy runs, with consistent results to what you see here and in the paper. Here is another one where I was up to 144 bpm or 77% of my maximal heart rate, so in what we could call zone 2 for me, also showing a quick re-normalization (even though I wasn’t running the whole time at that intensity, just a few 10 minutes segments):
High-intensity training
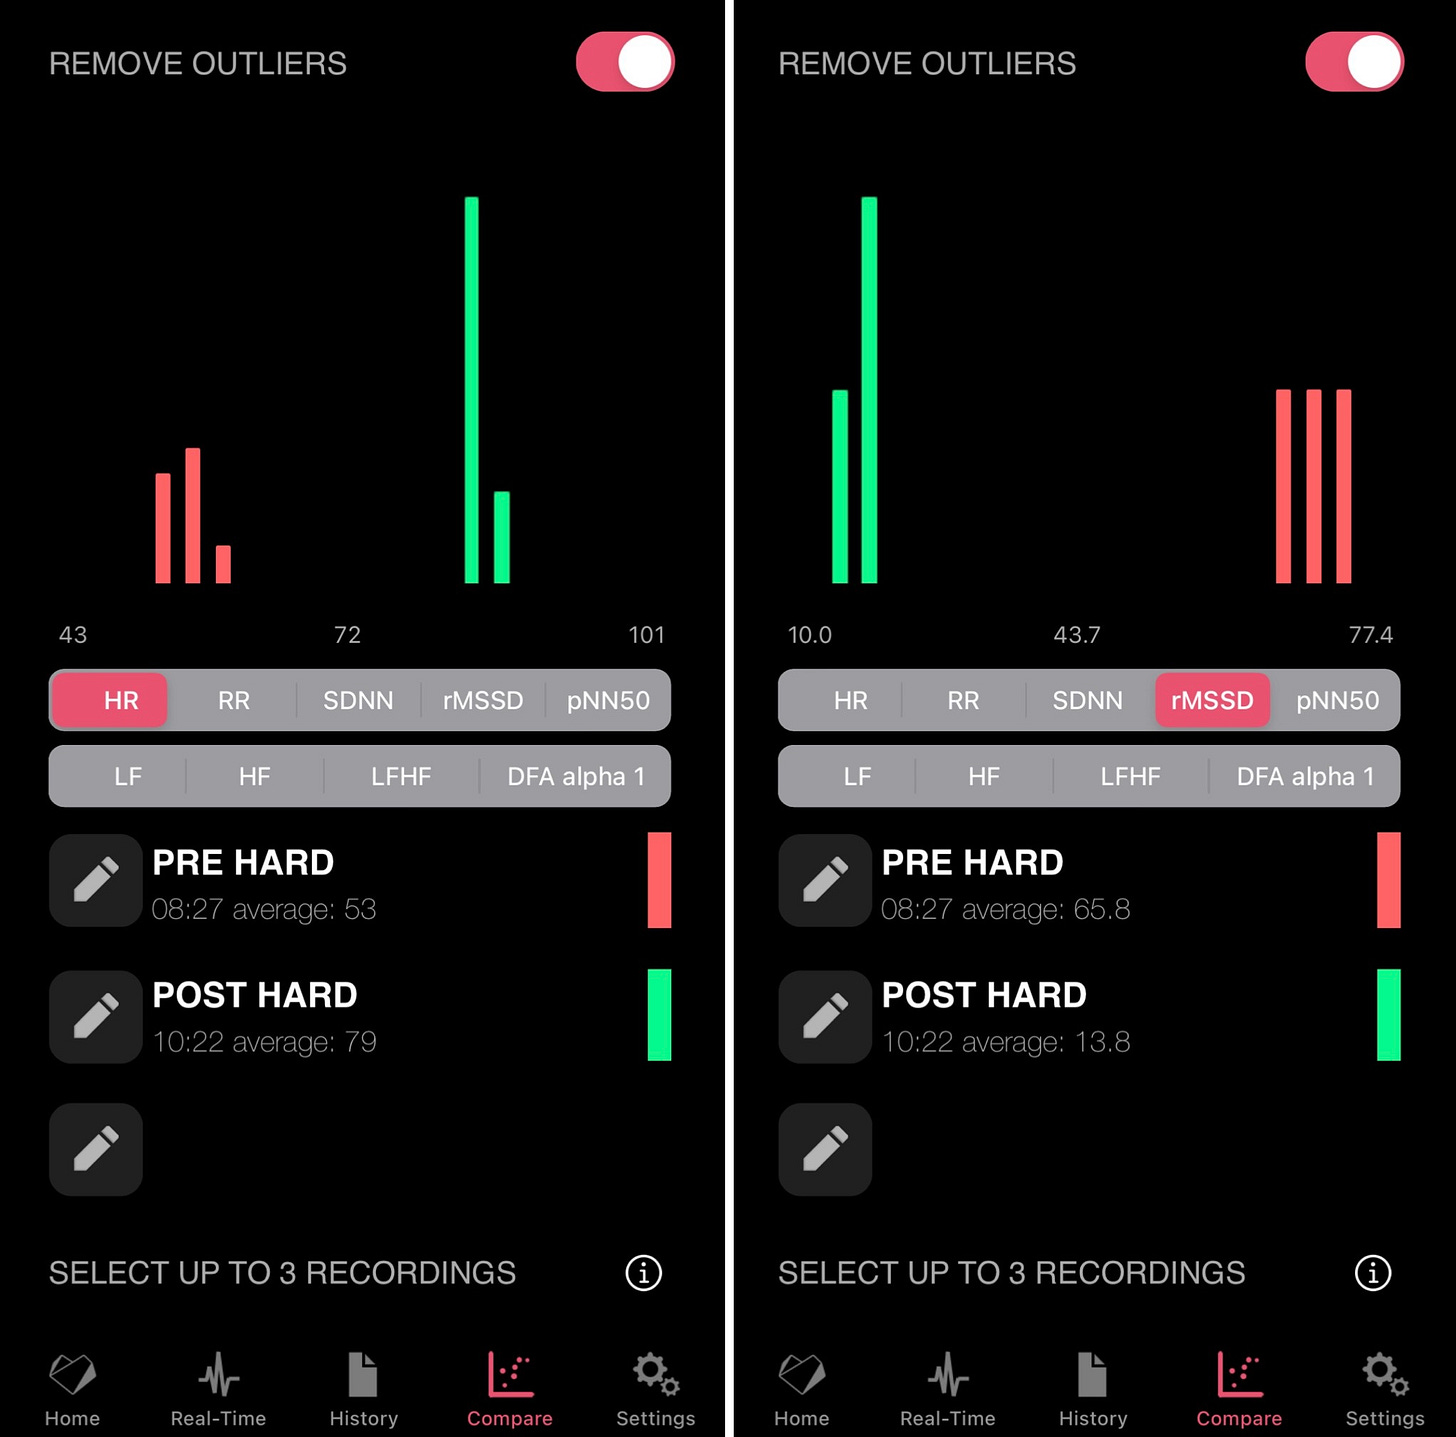
Let’s look at some high-intensity data as well. Below is one of the hardest workouts I’ve ever done, including almost 60 minutes of work at “threshold” (say 15 km pace for me), which resulted in the expected suppression:
Here is the same data, plus heart rate, to highlight the large difference between pre and post-training data:
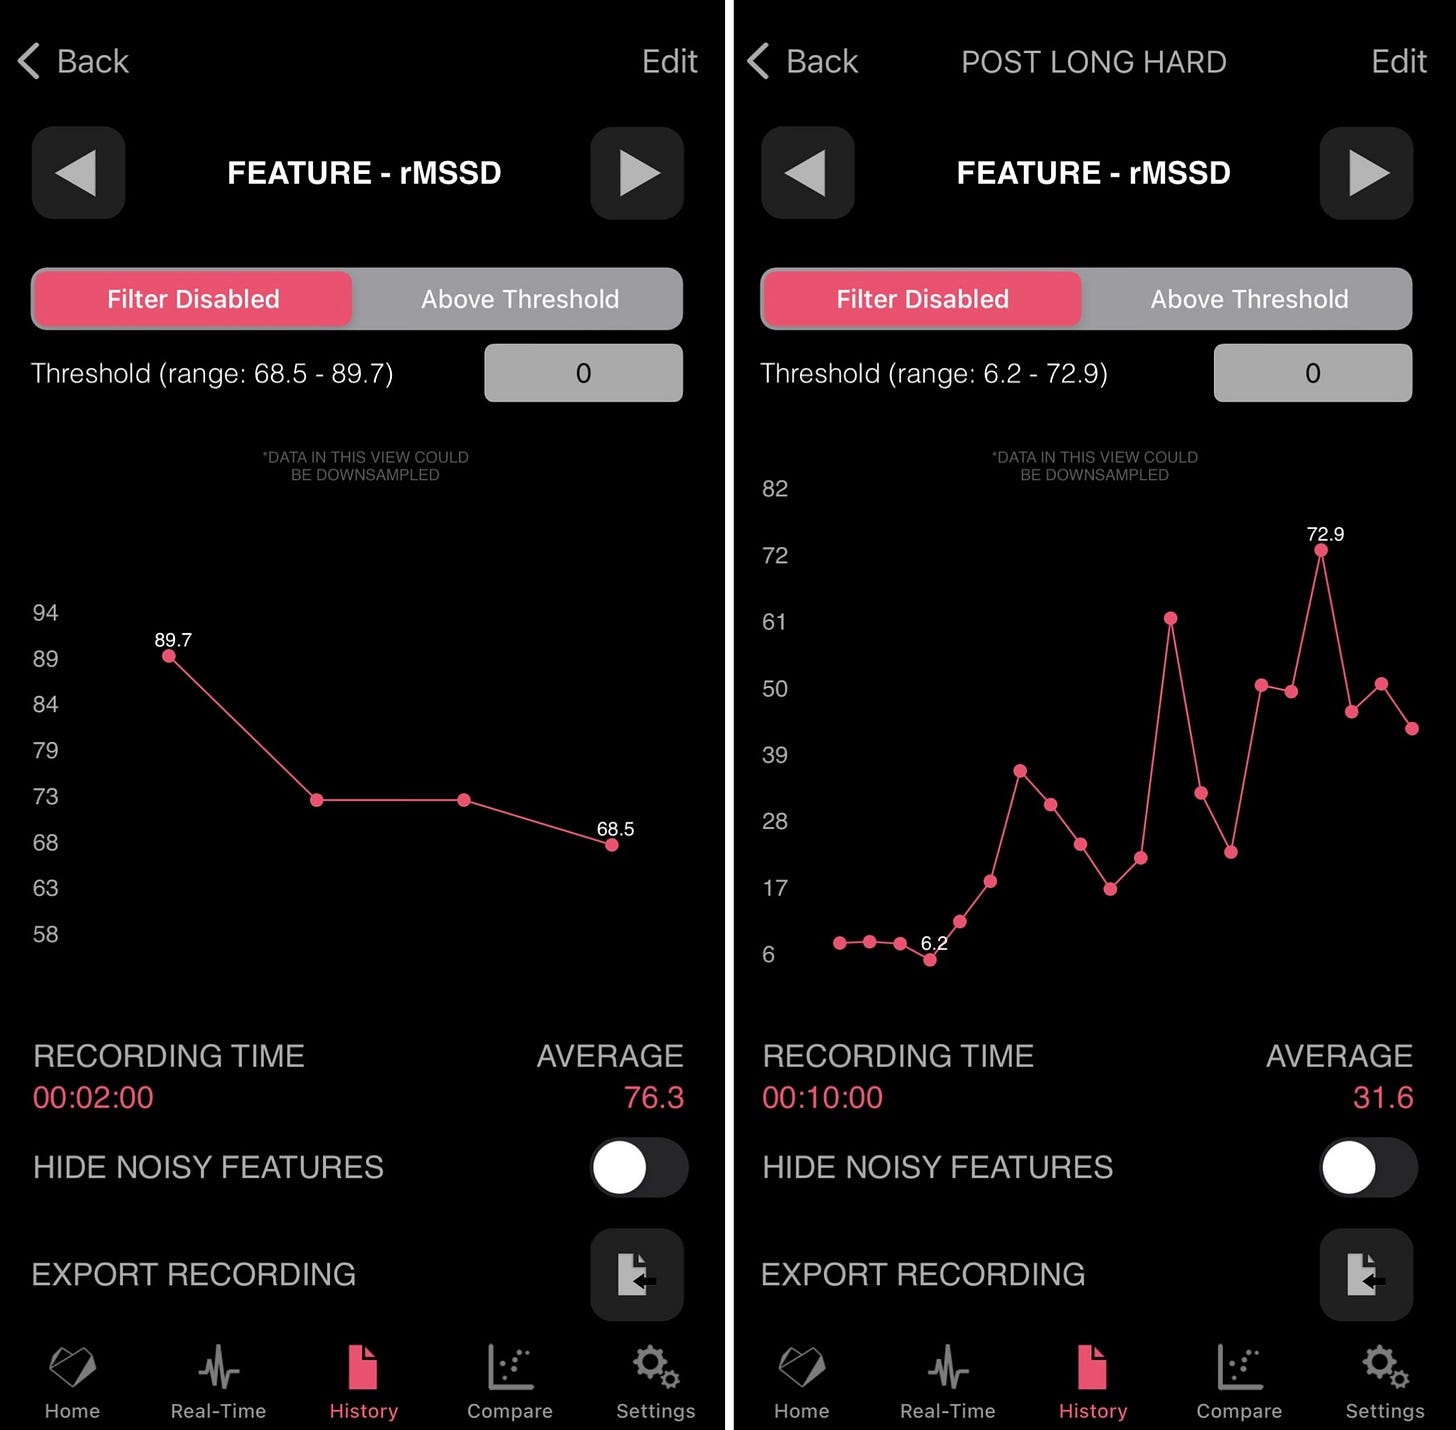
Finally, below is a long, hard run (15 km Z2 + 26 km at marathon pace).
The data is quite noisy after the run, as I was having more ectopic beats, but you can see the trend, going higher up over time, and settling at about 50 ms before I stopped the recording, from an initial value of 6 ms.
All of this data is quite consistent with the scientific literature and gives confidence that we can easily reproduce Stephen’s results, and explore a little more.
What to explore
Above I’ve shown some data at different intensities, but there are more aspects that I think can be interesting to explore:
duration: so far I have not seen differences in rMSSD pre and post-training for up to 3 hours of easy running, but I have not measured when running longer. Curious about where that limit is and how it evolves over time with training.
intensity: running closer to the aerobic threshold might be an interesting test to see if we are slipping into too-hard training or not.
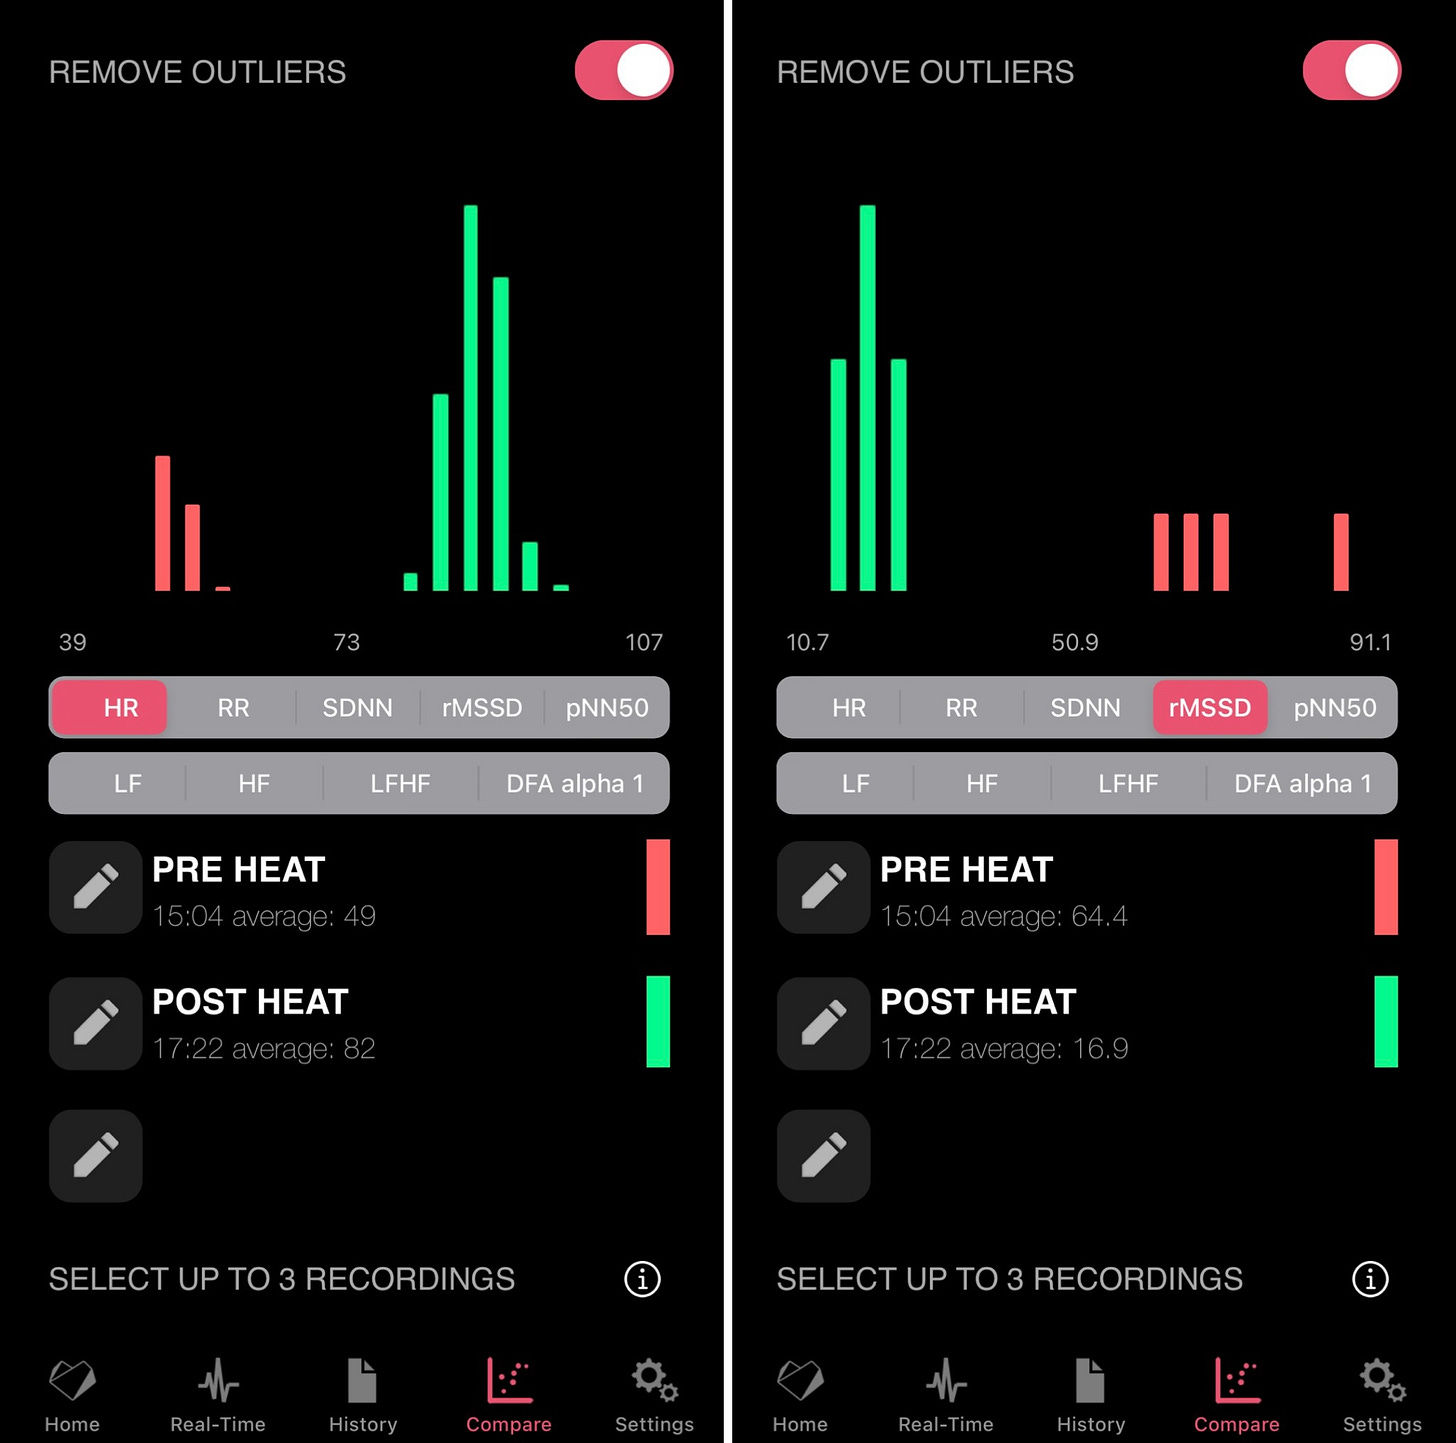
environmental stressors: last year I collected some really interesting data while training in the heat. For example, going out for a run in the heat and going slow to keep heart rate low, still resulted in a post-exercise HRV equivalent to doing really hard intervals (rMSSD < 10 ms). When I say that I cannot handle the heat, I am not kidding :)
fitness: in the paper, we can also see that the recovery phase is much quicker for better athletes. We might be able to see similar changes in our data as we get fitter, with recoveries from similar sessions getting quicker, eventually leading to a more stable heart rate variability when measured at rest, in the morning.
This type of data collection can be sometimes challenging, but despite the limitations and shorter data collection after exercise (with respect to lab studies), I think there is plenty of useful information to investigate.
Stephen and I have discussed this a few times, and we’d love to do a large user-generated data study outside of the lab.
Marco holds a PhD cum laude in applied machine learning, a M.Sc. cum laude in computer science engineering, and a M.Sc. cum laude in human movement sciences and high-performance coaching.
He has published more than 50 papers and patents at the intersection between physiology, health, technology, and human performance.
He is co-founder of HRV4Training, advisor at Oura, guest lecturer at VU Amsterdam, and editor for IEEE Pervasive Computing Magazine. He loves running.
Social:





Are the pre/post measurements conducted sitting in same manner as the standard morning measurement?
Hi Marco, you mention drinking during training is no problem, is that also the case post training pre measurement? And what time window would you advise post training in order to keep it practical but capture a good re-normalisation?
During the measurement: sitting up, no drinking, swallowing, talking etc. (things to avoid/take into consideration when measuring HRV.
Thanks for the great blog!