[Research] Recent Articles from the world of Heart Rate Variability (HRV)
Consistency is good.
Earlier this week I was reading a series of papers that Google Scholar notified me of, all recent articles in the world of heart rate variability (HRV). As I kept reading, it was clear that there wasn't anything new under the sun, but maybe more importantly, that all papers reported results consistent with our experience and past work (and previous research in general).
While there seems to be a constant chase for novelty (and by all means, learning something new at times is valuable), you have to appreciate when data and results are consistently replicated across the board, something that gives confidence about the work we've been doing and how we recommend measuring and using HRV data.
Here is an overview of these recent papers, showing the following:
HRV is more sensitive than heart rate to detect stress.
Training intensity determines the degree of HRV suppression.
Ultra-short (< 1 minute) measurements of HRV are as reliable as 5-minute ones.
HRV measurements taken with PPG are reliable both when lying down and sitting.
HRV in absolute terms is not a good discriminator of athletic ability (make sure to read the papers and carefully look at the data, not just the titles and abstracts!)
HRV data collected during the day with wearables and optical sensors is of poor quality.
Studies in Detail
Below I cover in a bit more detail each point, showing our previous research on the topic.
1. HRV is more sensitive than heart rate to detect stress
Tomes et. al. “Heart rate variability is more sensitive to stress than heart rate in specialist police undergoing selection“. Read the full study here.
Study findings: While heart rate often shows delayed or minimal changes, HRV metrics like RMSSD and LF-HF ratio provide earlier and more detailed insights into stress responses, making it a preferred tool in both research and practice.
Below is an example of what we have shown in our research a few years ago, on the relation between resting heart rate, HRV, and training load - with breakdowns by sex and age group. As expected, heart rate is consistently increased on days following higher intensity training load, while rMSSD is consistently reduced. However, and most importantly, relative changes in rMSSD are larger, highlighting how HRV can be more sensitive to training intensity. Additionally, percentage changes in heart rate reduced with age while remaining constant for rMSSD.

2. Training intensity determines the degree of HRV suppression
Leal-Menezes et al. “High-intensity interval aerobic exercise delays recovery from heart rate variability: a systematic review with meta-analysis“ Read here.
Study findings: High-intensity intervals delay autonomic recovery, confirming similar findings from Seiler et al. (2007) and my own research.
Apart from the greater sensitivity of HRV with respect to heart rate when it comes to detecting stressors, there is also a quite clear dose-response relationship between training intensity and HRV. This is something we have also shown in the same paper cited above, where the degree of suppression in HRV was tightly coupled to the intensity of the workout, see below.

3. Ultra-short (< 1 minute) measurements of HRV are as reliable as 5-minute ones.
Tomes et al. “Ultra-short-term versus short-term measures of heart rate variability in specialist police units: A pilot reliability study“ Read here.
Study findings: HRV features remain reliable in as little as 30 seconds, similar to what Flatt and Esco showed years ago, and I’ve replicated with our lab data.
When measuring HRV in the morning, I typically recommend a 1-minute measurement duration. At this point, several studies have shown that as little as 30 seconds can be effective in capturing rMSSD, our parameter of interest. However, we also have to recognized that the shorter we go, the more variability there is in repeated measures, especially for measurements of 10-30 seconds, which might include very few breathing cycles. A 1-minute measurement is the best compromise, in my opinion (2 minutes max). Below is an example of data I have collected in the lab.
4. HRV measurements taken with PPG are reliable both when lying down and sitting
Rogers et al. “Test–Retest Reliability and Concurrent Validity of Photoplethysmography Finger Sensor to Collect Measures of Heart Rate Variability“ Read here.
Findings: Finger PPG sensors (like the CorSense here) show strong reliability in both seated and supine positions, with data comparable to ECG.
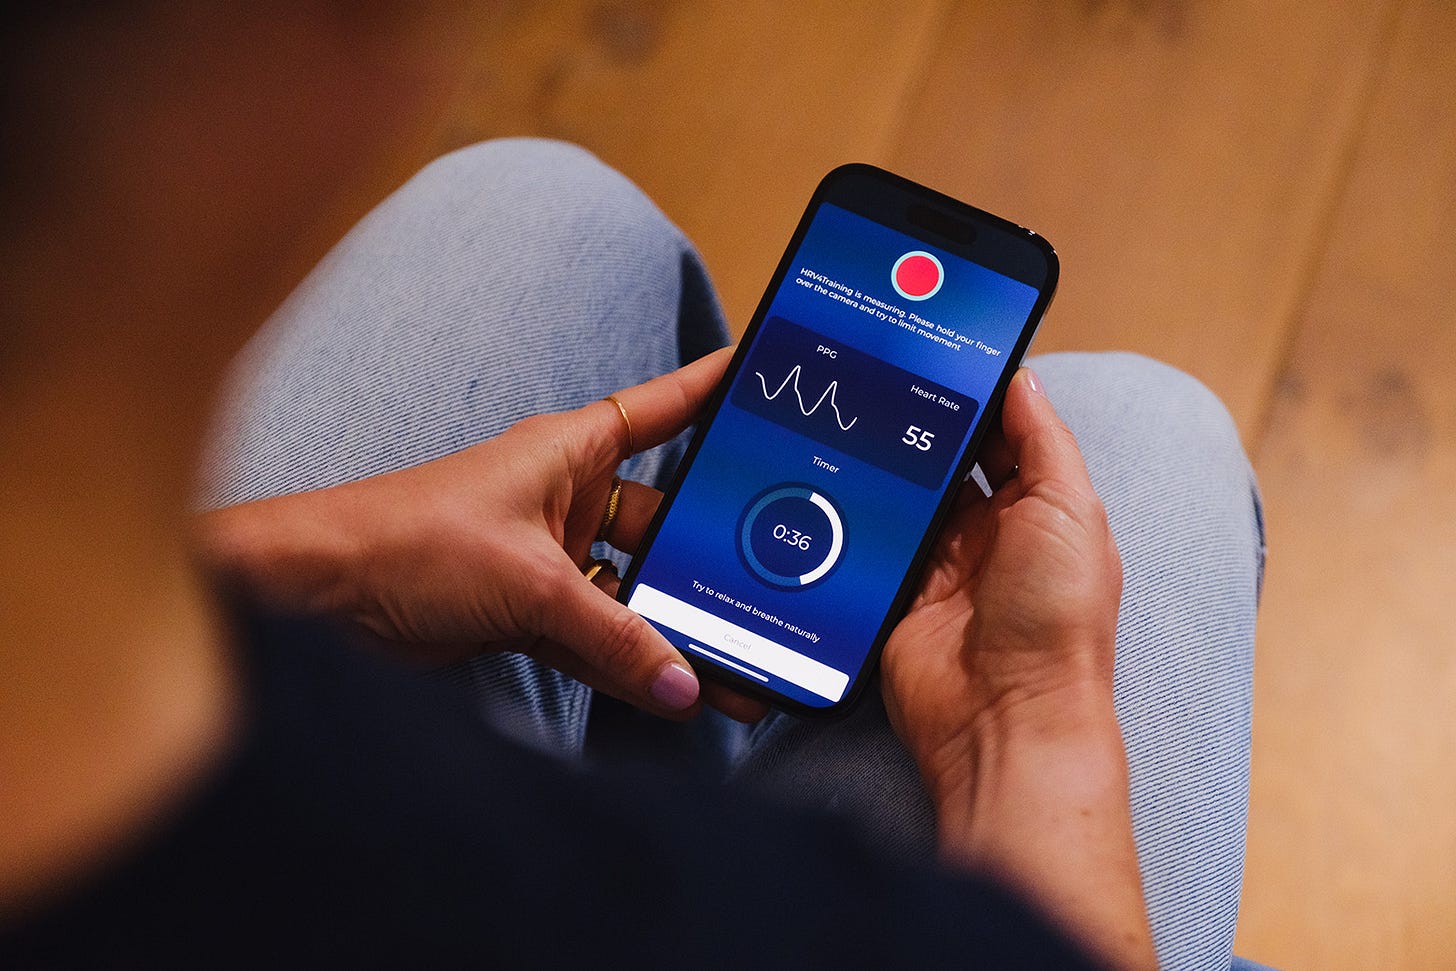
On a similar note, Rogers et al. look at the test-retest reliability and concurrent validity of a PPG sensor, showing that both in supine and seated positions the PPG sensor worked really well (this is the finger sensor by Elite HRV, which is now discontinued, because research is always ahead of the game!). Jokes apart, this is good as it shows that when we develop a sensing modality with HRV in mind, just like we did for HRV4Training, the data is basically equivalent to ECG (for most people), and the reliability is extremely high even in different body position, which speaks to the protocol we highly recommend, especially for endurance athletes: always measure in the morning, seated. An ideal way to capture your response.
Here is some more data I collected, also looking at repeated measures with paced and self-paced breathing, showing no differences:
While below is PPG vs ECG for our validation of HRV4Training:

5. HRV in absolute terms is not a good discriminator of athletic ability
Estrella & Capdevila. “Identification of Athleticism and Sports Profiles Throughout Machine Learning Applied to Heart Rate Variability“ Read here.
Findings: While the authors claim HRV can distinguish athletes from students, the real discriminator is heart rate, not HRV.
This one requires more details. In particular, Estrella and Capdevila looked at using HRV to distinguish athletes from students. While the claim of the paper is the opposite of my take, i.e. that you can use HRV for this purpose, here I'd like to show you how HRV has in fact very little predictive power, and as I've shown many times in the past, it is heart rate - not HRV - that has a strong link to cardiorespiratory fitness. (which is also what we can see in the paper, see Figure 2).
In particular, looking at the "HRV" indices used in the paper, we have mRR or the average of the RR intervals. This is nothing other than the inverse of heart rate (you compute heart rate using the average of the RR intervals, from an ECG, hence they are the same thing). Looking at the data we can even reconstruct heart rate from mRR, as means and standard deviations are reported, I could do the math and athletes would end up with mean plus or minus one standard deviation between 47 and 63 bpm, while students with heart rates between 58 and 79. Needless to say, there is very little overlap in heart rate between groups and all you need to classify them with reasonable accuracy is their resting heart rate. HRV is not only highly dependent on heart rate (see my discussion here), but also much closer between the groups (as there are genetic components that are not fitness-related). rMSSD for non-athletes is between 29 and 118 ms while for athletes is between 31 and 131 ms (again means plus or minus one standard deviation), which is an almost complete overlap.
Below is another way to look at the same thing, which we also published. In particular, you can see the relationship between resting heart rate, rMSSD, and both age and physical activity level. In addition, we showed how the association between heart rate and physical activity level remains strong across all age groups, while for rMSSD, it becomes weak for older individuals.

6. HRV data collected during the day with wearables and optical sensors is of poor quality
Rehman et al. “Assessment of Physiological Signals from Photoplethysmography Sensors Compared to an Electrocardiogram Sensor: A Validation Study in Daily Life“. Read the full study here.
Findings: This study compared HR and HRV measurements from photoplethysmography (PPG) sensors against electrocardiogram (ECG) monitors in free-living conditions over 10 days. PPG accuracy was higher during rest and sleep but decreased during active periods (Whoop’s coverage data dropped from 77%–88% during the night to 19%–31% during the day).
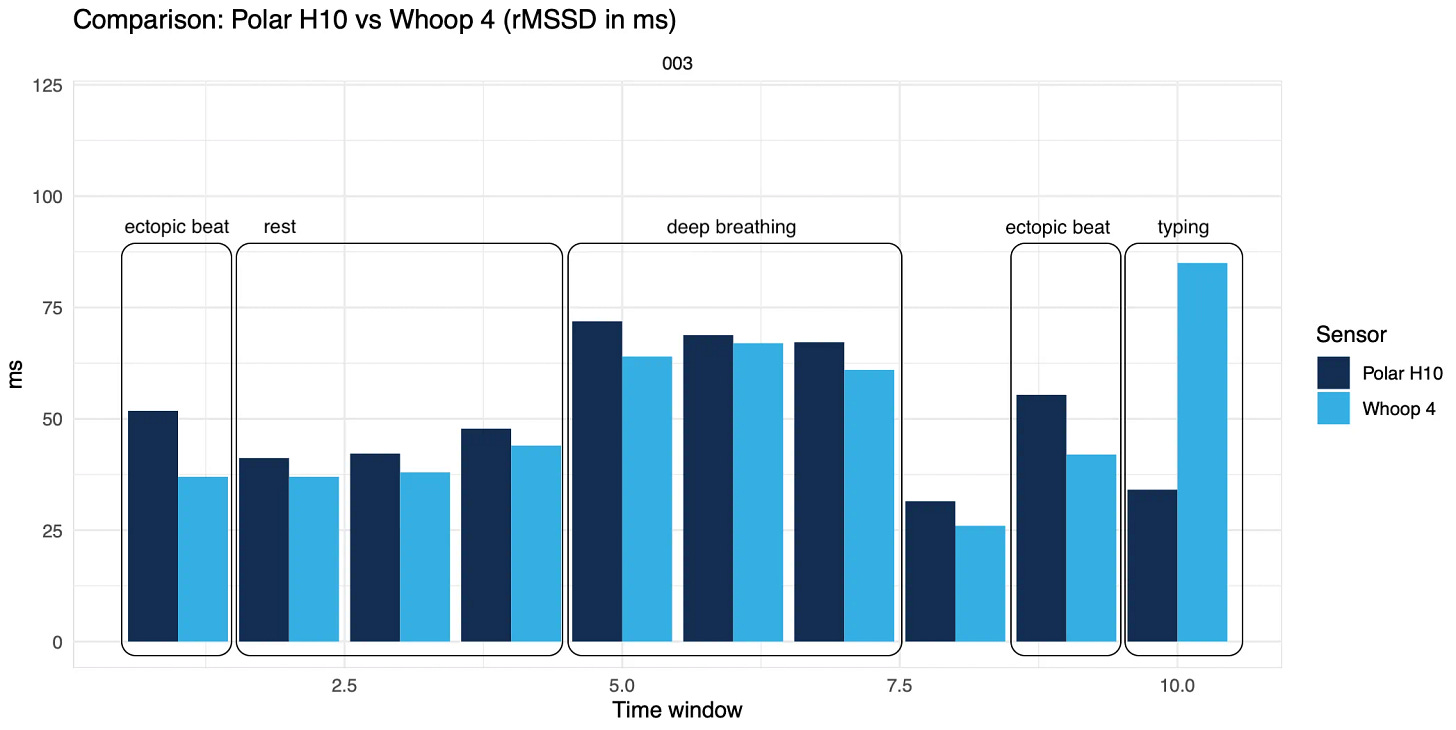
PPG technology, or optical measurements (the ones provided by wearables), cannot be used under conditions that are not of complete rest. Any minimal motion will trigger artifacts so large that HRV analysis cannot be carried out (even when heart rate can still be recovered with high accuracy).
Consider that just typing on your computer or slightly contracting a muscle makes HRV data collected from wearables completely unusable, artificially increasing HRV 3+ times, just because of artifacts. See an example below.

Wrap up
I'm often asked what is new about HRV and our work, and I often say that nothing is new.
We've done this for a long time, replicated it, updated our knowledge and recommendations based on multiple studies, and eventually, what we have in our Ultimate Guide is state-of-the-art best practices in terms of how the data should be collected and used if we want to capture our stress response effectively.
Consistent replication across studies gives us confidence.
I’ll keep reading, just in case.
See also:
Marco holds a PhD cum laude in applied machine learning, a M.Sc. cum laude in computer science engineering, and a M.Sc. cum laude in human movement sciences and high-performance coaching.
He has published more than 50 papers and patents at the intersection between physiology, health, technology, and human performance.
He is co-founder of HRV4Training, advisor at Oura, guest lecturer at VU Amsterdam, and editor for IEEE Pervasive Computing Magazine. He loves running.
Social:


