
Should We Normalize HRV by Heart Rate?
Probably yes.

When it comes to heart rate variability (HRV), one common question is whether we should normalize HRV by heart rate. Heart rate and HRV are physiologically linked. A lower heart rate typically corresponds to a higher HRV (e.g. because of higher parasympathetic activity). However, the relationship is not only physiological but also mathematical, which might motivate the need for normalization.
The easiest way to understand this is to look at the graph put together by Jerzy Sacha, in his paper "Why should one normalize heart rate variability with respect to average heart rate" (full text here). Here is the figure:

Also from the paper: (A) The non-linear (mathematical) relationship between R-R interval and heart rate is depicted. One can see that the oscillations of a slow average heart rate (x-axis, dark gray area) result in much greater oscillations of RR intervals (y-axis, dark gray area) than the same oscillations of a fast average heart rate (light gray area). As a consequence, the variability of R-R intervals is higher for the slow average heart rate than for the fast one, despite the fact that the variability of heart rate is the same (reprinted with modification from Sacha and Pluta, 2008). (B) The relationship between heart rate and R-R interval is shown—the same oscillations of R-R intervals yield much greater oscillations of HR for the fast average heart rate (dark blue area) than for the slow one (light blue area). Consequently, the variability of HR is higher for the case with fast average heart rate, despite the fact that the variability of R-R intervals is the same in both cases.
In short, mathematically, HRV metrics are related to the variability between RR intervals, which are inversely related to heart rate. As heart rate decreases, RR intervals lengthen, and there’s simply more "room" for variability. Without normalization, HRV can appear inflated in individuals with low heart rate and suppressed in those with higher heart rate, even if their autonomic modulation is similar. Maybe this is also one of the issues behind reliance on absolute values of HRV to stratify health risk, something I am not a fan of (see additional considerations here and here).
Given this mathematical relationship, dividing HRV by heart rate might provide a cleaner, more standardized metric.
But is this always a good idea? And, more importantly, does it hold true for individuals, or does this approach primarily serve large-scale, population-level analysis?
Population-Level Analysis
At the population (or group) level, normalizing HRV by heart rate can probably help.
Studies often want to isolate the effects of specific interventions (like exercise training or stress reduction techniques) on autonomic function without the “noise” introduced by differences in baseline heart rate. Dividing HRV by heart rate (or using other transformations), researchers might create a more consistent baseline across participants.
For example, a study comparing HRV between different groups might find higher HRV in one group, but much of this difference could be driven by the lower resting heart rate in the cohort. Normalization might help focus the analysis on the modulation of the autonomic nervous system rather than the structural constraints imposed by heart rate differences.
Individual-Level Analysis
If you are tracking HRV, typically you are interested in how your data changes over time, in relation to various stressors (if you are new to this, check out my guide to HRV, here).
This is where things get tricky. While in theory, looking at the ratio between HRV and heart rate might hide information (just like made up readiness / recovery scores, aggregating information often leads to less useful insights, see here or here), potentially masking the autonomic changes you're trying to track and HRV’s higher sensitivity to stress, in my experience this is typically not the case (quite the contrary!).
Normalized HRV can instead provide useful insights. For example, on days when heart rate drops and HRV is stable, normalized HRV reflects that despite more room for variability, your HRV has not increased, and is in fact lower than your normal.
This is exactly what I can see with caloric deficit, as I discussed here. Another example is cold exposure, something that is more and more popular. A recent review mentions how cold exposure increases HRV. But is that change in HRV really driven by a change in parasympathetic activity? If I think about the physiology, here is what happens: cold exposure leads to vasoconstriction, which leads to increased blood pressure, which leads to reduced heart rate via the baroreflex (the mechanism that tightly regulates the two). Based on this, the change in HRV might just be due to a reduction in heart rate. In fact, vasoconstriction is under sympathetic control, while HRV captures changes in parasympathetic activity, and as such, the change in HRV due to cold exposure might have nothing to do with parasympathetic activity. This is the issue of using HRV as a proxy of parasympathetic activity or “stress” without understanding the underlying physiology and how HRV (i.e. practically speaking, the variability between heartbeats) can change for a number of reasons, some of them unrelated to parasympathetic activity (which is also why good measurement protocols are so important!). In this context, normalized HRV could be a better marker than HRV alone, as it would not conflate the change in HRV.
The most important question for me is always this: does normalization improve the actionable insights we derive from HRV data? My current take is that the answer is probably yes, especially if we have a stable or below normal heart rate, which could be the case in many situations (e.g. dieting, but also cold exposure, accumulated fatigue, or higher parasympathetic activity associated with fatigue, more than recovery).
A recent paper by Bulte et al., looked at Normalized HRV in relation to training load in state and international-level swimmers, concluding that it “may provide a more comprehensive evaluation of an athlete’s physiological status compared with a sole parasympathetic modulation or tone marker“ - given their results in which Normalized HRV was the only parameter that correlated with training overload (while heart rate or HRV didn’t)
I’ve added normalized HRV to HRV4Training Pro, so that you can also verify by yourself if this is something that helps you using your data.
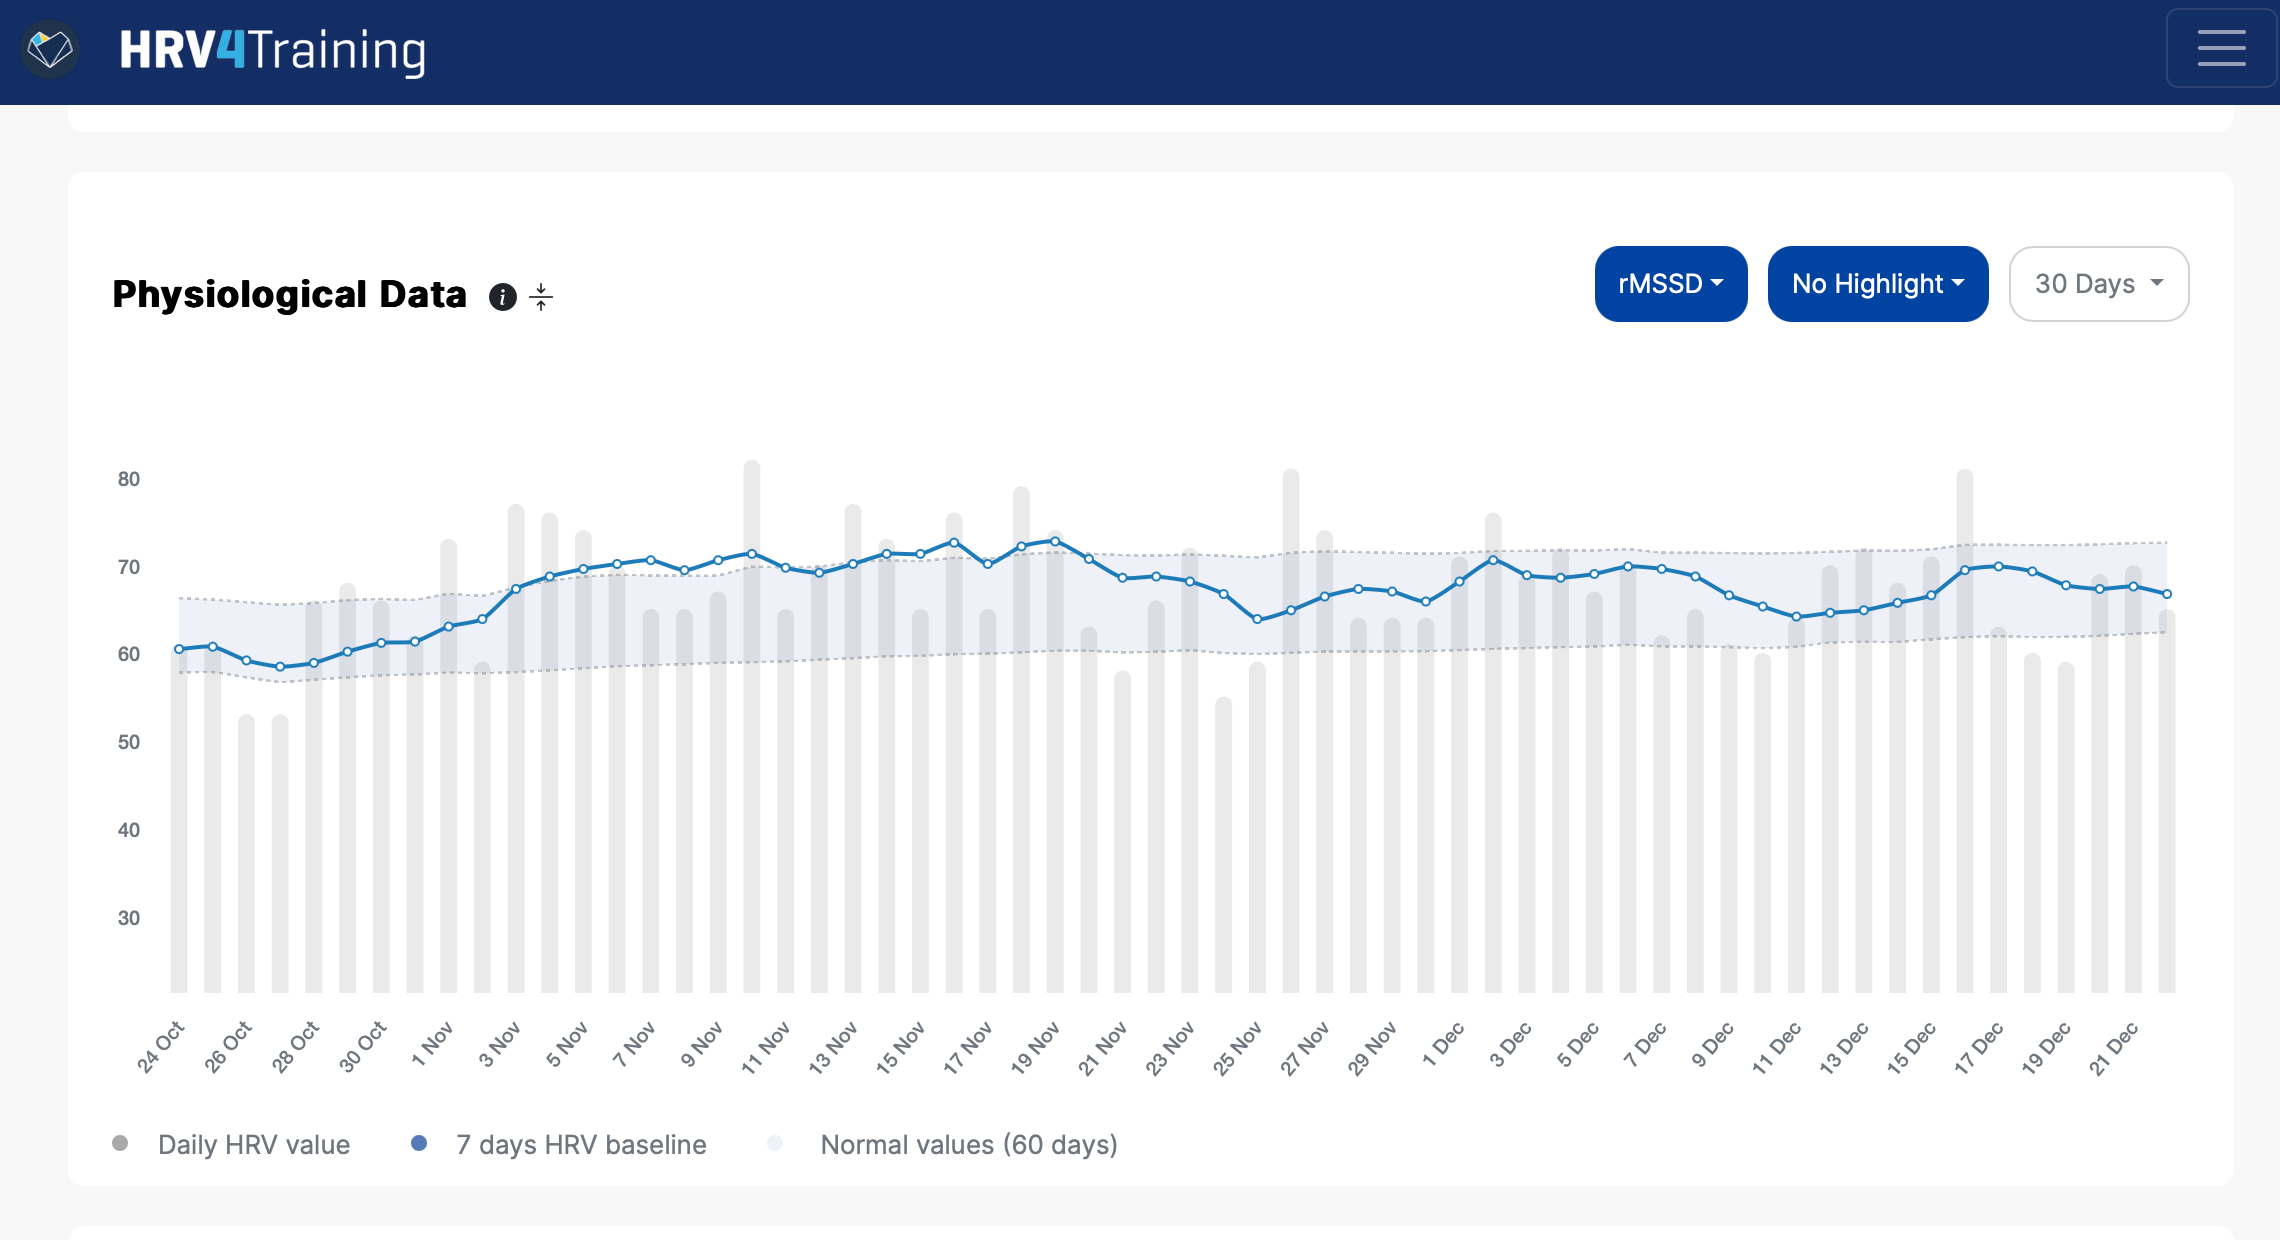
Here is an example for my own data, in a phase of caloric restriction in which we expect a lower heart rate (see here). First the HRV data:
and then the resting heart rate data:

When looking at Normalized HRV (which you can pick as HRV:HR in HRV4Training Pro) we see that it better reflects my current situation (i.e. quite tired and low on energy, due to the caloric deficit).

To Normalize or Not To Normalize?
At the population level, normalization can improve statistical clarity. At the individual level, there can also be benefits in looking at the data this way.
If you're a coach, athlete, or anyone using HRV to guide decisions, focus on consistent protocols and track trends over time in multiple parameters with respect to their individual normal range: this is the more effective and established way at the moment.
This being said, it can be helpful to also look at Normalized HRV (HRV:HR in HRV4Training Pro) and see if you can derive useful patterns under certain circumstances, as I have shown above for my own data or as it has been reported in the latest scientific literature on the topic.
Normalized HRV likely helps in not getting fooled by increases in HRV associated with a drop in heart rate (e.g. caloric deficit, cold exposure, and possibly, many other stressors) and other situations.
As always, keep experimenting; this field is as dynamic as the data we study!
How to Show Your Support
No paywalls here. All my content is and will remain free.
As a HRV4Training user, the best way to help is to sign up for HRV4Training Pro.
Thank you for supporting my work.
Endurance Coaching for Runners
If you are interested in working with me, please learn more here, and join the waiting list by filling in the athlete intake form, here.
Resources

Marco holds a PhD cum laude in applied machine learning, a M.Sc. cum laude in computer science engineering, and a M.Sc. cum laude in human movement sciences and high-performance coaching. He is a certified ultrarunning coach.
He has published more than 50 papers and patents at the intersection between physiology, health, technology, and human performance.
He is co-founder of HRV4Training, Endurance Coach at Destination Unknown Endurance Coaching, advisor at Oura, guest lecturer at VU Amsterdam, and editor for IEEE Pervasive Computing Magazine. He loves running.
Social:
Would it make more sense to divide HRV by resting heart rate interval?
I.e., HRV=50ms, RHR=50/min, heart rate interval = 1.2s
Normalised hrv = 50ms/1.2s