In the data below, I want to look at important differences between morning and night HRV data, as these two protocols and the resulting data can differ, in relation to acute responses to stressors.
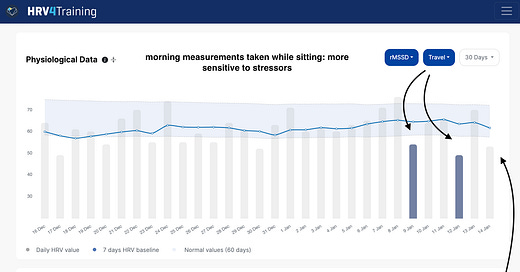
In the top plot, we can see morning HRV data taken while sitting up. As discussed a few times, this is a protocol that makes it easier to capture your stress response. Please see this blog for a broader discussion:
We can indeed see that both travel (color-coded) and high-intensity training (I used RPE as a simple marker of intensity) have an impact, despite baseline HRV being still within the normal range:
We have three suppressions below the normal range in the last week, when looking at morning data.
This added variability due to suppressions and quick rebounds within normal range, is what is captured by the coefficient of variation, another important metric to determine your stress response, which you can find in HRV4Training: a higher coefficient of variation is often associated with a less than ideal response.
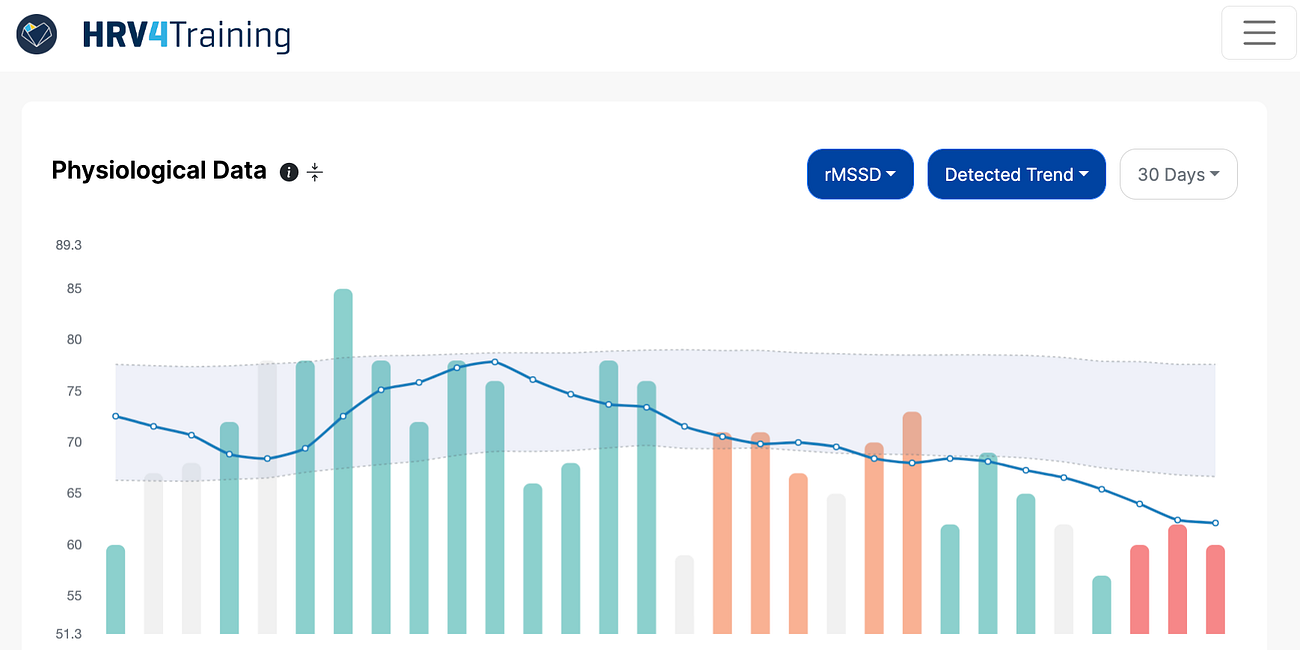
In night data, none of this is visible: there are zero suppressions.
Sleep is a highly parasympathetic state that is less useful for capturing your stress response, especially in endurance athletes who tend to have quite low resting heart rates.
My HRV is always good in the night, unless I am sick or stressed to a level that requires no wearable to be aware of. Data collected in the morning, while sitting, challenges the body in a way that makes it possible to capture more relevant responses.
There's more in the data than just averages and normal ranges, the variability in the data itself, over a few days (i.e. the coefficient of variation), can provide additional insights. Please see this other blog for more information about trends and the coefficient of variation:
Morning data in this case allows us to understand that we are in a situation where we are still able to cope with the stressors imposed on the system (i.e. we bounce back right after a suppression), but that we are probably at our limit (frequent suppressions, increased coefficient of variation) a good moment to make some small adjustments to either reduce stressors or prioritize recovery, quite possibly.
None of this is visible in the night data (bottom plot).
Marco holds a PhD cum laude in applied machine learning, a M.Sc. cum laude in computer science engineering, and a M.Sc. cum laude in human movement sciences and high-performance coaching.
He has published more than 50 papers and patents at the intersection between physiology, health, technology, and human performance.
He is co-founder of HRV4Training, advisor at Oura, guest lecturer at VU Amsterdam, and editor for IEEE Pervasive Computing Magazine. He loves running.
Social:
Twitter: @altini_marco.
Personal Substack.


Nice one! Given that I already wear an oura ring should I continue with that since I’ve been using it since gen 1, and therefore have lots of data to compare my current data to? Or should I switch to the camera?
Good article!