What's your normal range for heart rate variability (HRV)?
Defining your frame of reference is key to interpreting and making use of the data
One of the challenges when it comes to making sense of heart rate variability (HRV) data is that there is no universal frame of reference. After taking our first measurement, we haven’t really learned anything useful.
Naive tools add to the confusion by oversimplifying with the “higher is better” approach to HRV analysis, which makes little sense.
How should we interpret our data then?
I often talk about your “normal range” as the only meaningful way to make use of HRV data. But what is this normal range and why is it important?
Simply put, your normal range is a representation of your historical data that defines your own, individual, frame of reference. It allows you to understand if acute (daily) and chronic (weekly) HRV responses are showing meaningful changes or just small variations that you should not worry about.
Your normal range makes the data actionable.
Why do we need normal values? This has to do with 1) the lack of a universal frame of reference 2) the high day-to-day variability in HRV data.
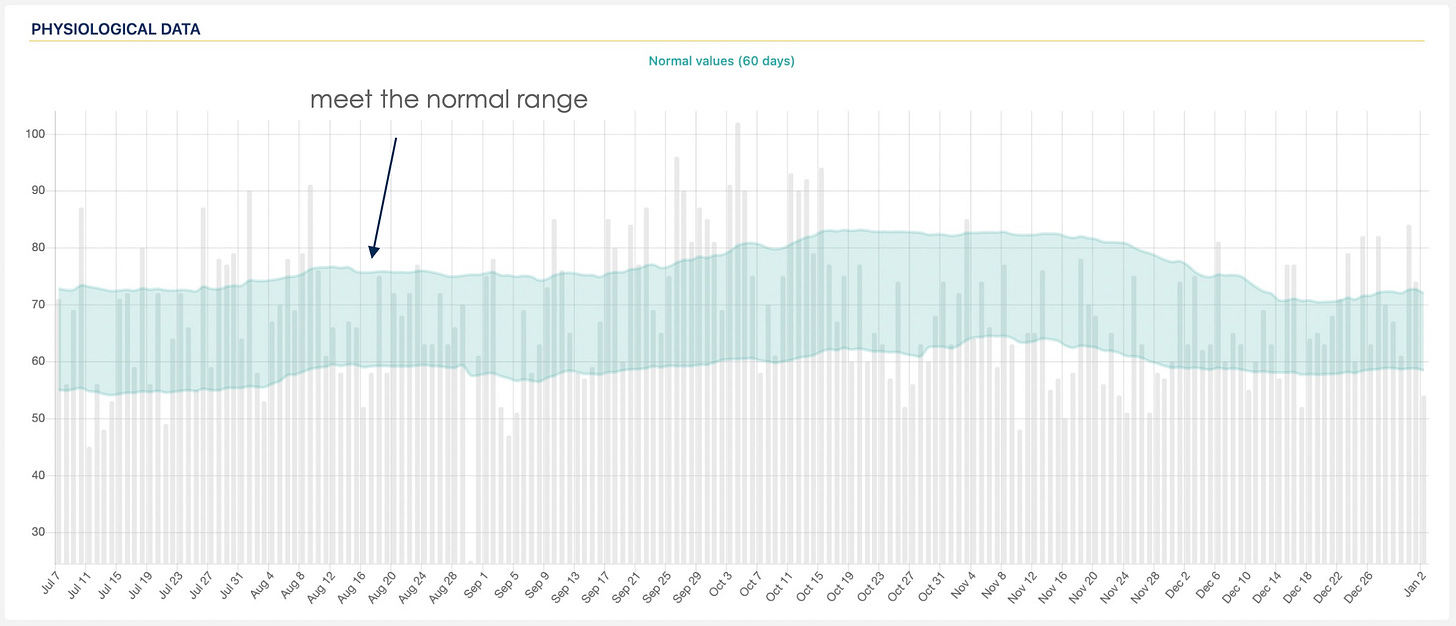
It might be easier to show this with an example. Let's look at the data below. This is typical HRV data, there is much variability between consecutive days over a long period of time, without a clear trend (because as you know, stability is what highlights a positive response to stressors):
Should the highlighted reduction trigger concerns and adjustments in our plans or not?
To answer this question, we introduce the normal range:
The normal range in HRV4Training helps you better understand when variations in heart rate and HRV are important.
It is normal for heart rate and HRV to fluctuate quite a bit on a day-to-day basis, and it is key to be able to determine what changes are just part of normal day-to-day variability, and what changes are worth paying attention to.
For example, a daily score or baseline below normal values for HRV data, identifies a day or period of increased stress, something to be cautious about. On the other hand, if your score is just a little lower than yesterday, but still within normal day-to-day variability, that's typically nothing to worry about. Without a normal range, you would be always reading into useless information (e.g. if my HRV today is 61 ms, and yesterday it was 71 ms, today my HRV is not worse than yesterday, it is the same, as, in both occasions, it is within my normal range).
HRV4Training makes it easy to differentiate between these conditions.
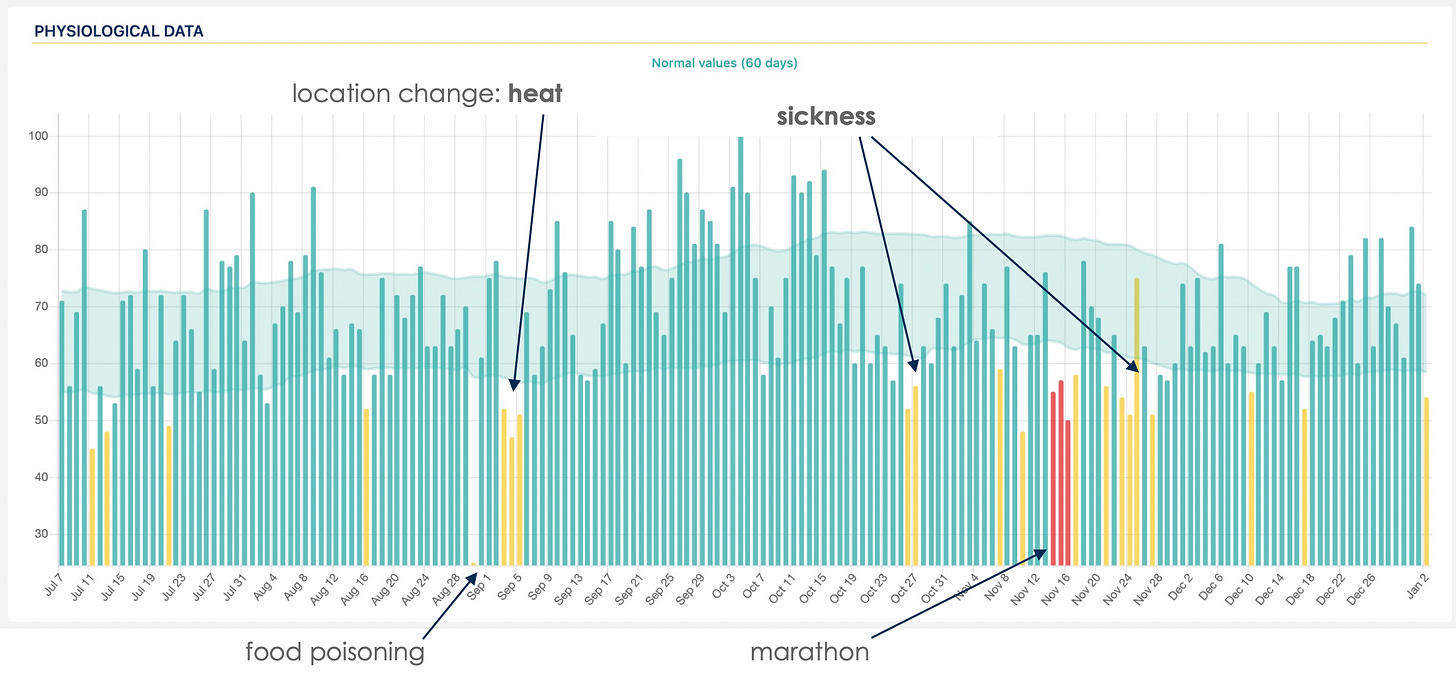
Let’s keep going with our example, highlighting days with suppressions outside of the normal range:
In the image below, I’ve also added the actual stressors, so that we can see how they typically align with suppressions in HRV:
How do we build your normal range in HRV4Training?
Currently, we use the past 60 days of your measurements to build your normal values. As soon as you start using the app, HRV4Training will start learning what day-to-day changes are normal for you, and what changes are outside your normal range. As you gather more data, the app will get better at this job, eventually giving you the best estimate when having all the 60 days of data.
The normal values are always kept current so that you are not stuck in older data, but at any given time, the most recent 60 days are always used. Over the years, we made a few adjustments to this method, but we believe that 60 days is a great trade-off between 1) not being too reactive, or adjusting your normal values too quickly for example using just the past few weeks of data. In this case, your data would consider a long chronic suppression as normal (e.g. when getting sick) 2) not getting stuck in very old measurements or in seasonal changes that might have little to do with your current status, which is what would happen when using more data. For heart rate and HRV, 60 days of data seems to be just right.
How do we show your normal range?
Collecting high-quality data using either our validated camera-measurement, a chest strap, or an Oura ring, is only the first step. Once we have collected high-quality data we need to be able to properly interpret it with respect to our own historical data.
On a daily basis, HRV4Training compares your daily score with your normal values. You can see this comparison and a visualization on the homepage of the app:
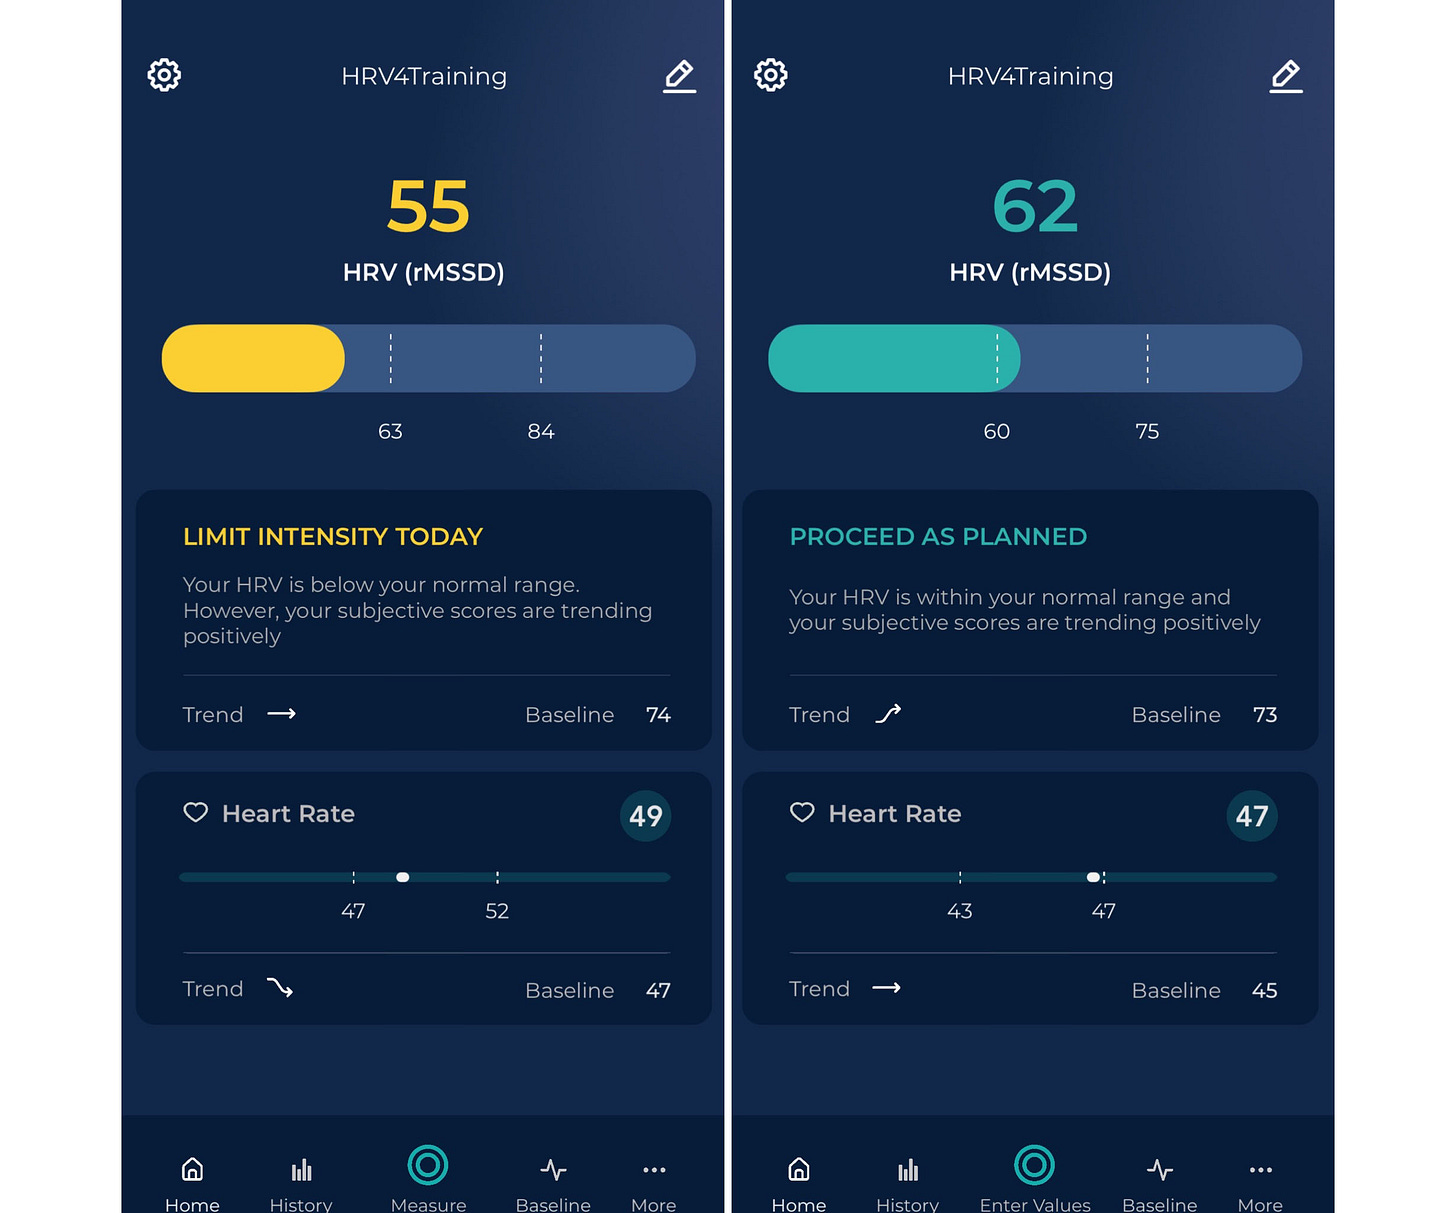
The text on the homepage will also report if your score is within your normal values or not, as you can see below. What you aim for typically, is a stable physiological condition, so scores within normal on most days.
Making adjustments such as trying to reduce training intensity or other stressors when your HRV is below your normal values, can be an effective strategy to better balance stress, and improve outcomes in the longer term.
This is also the approach used in HRV-guided training.
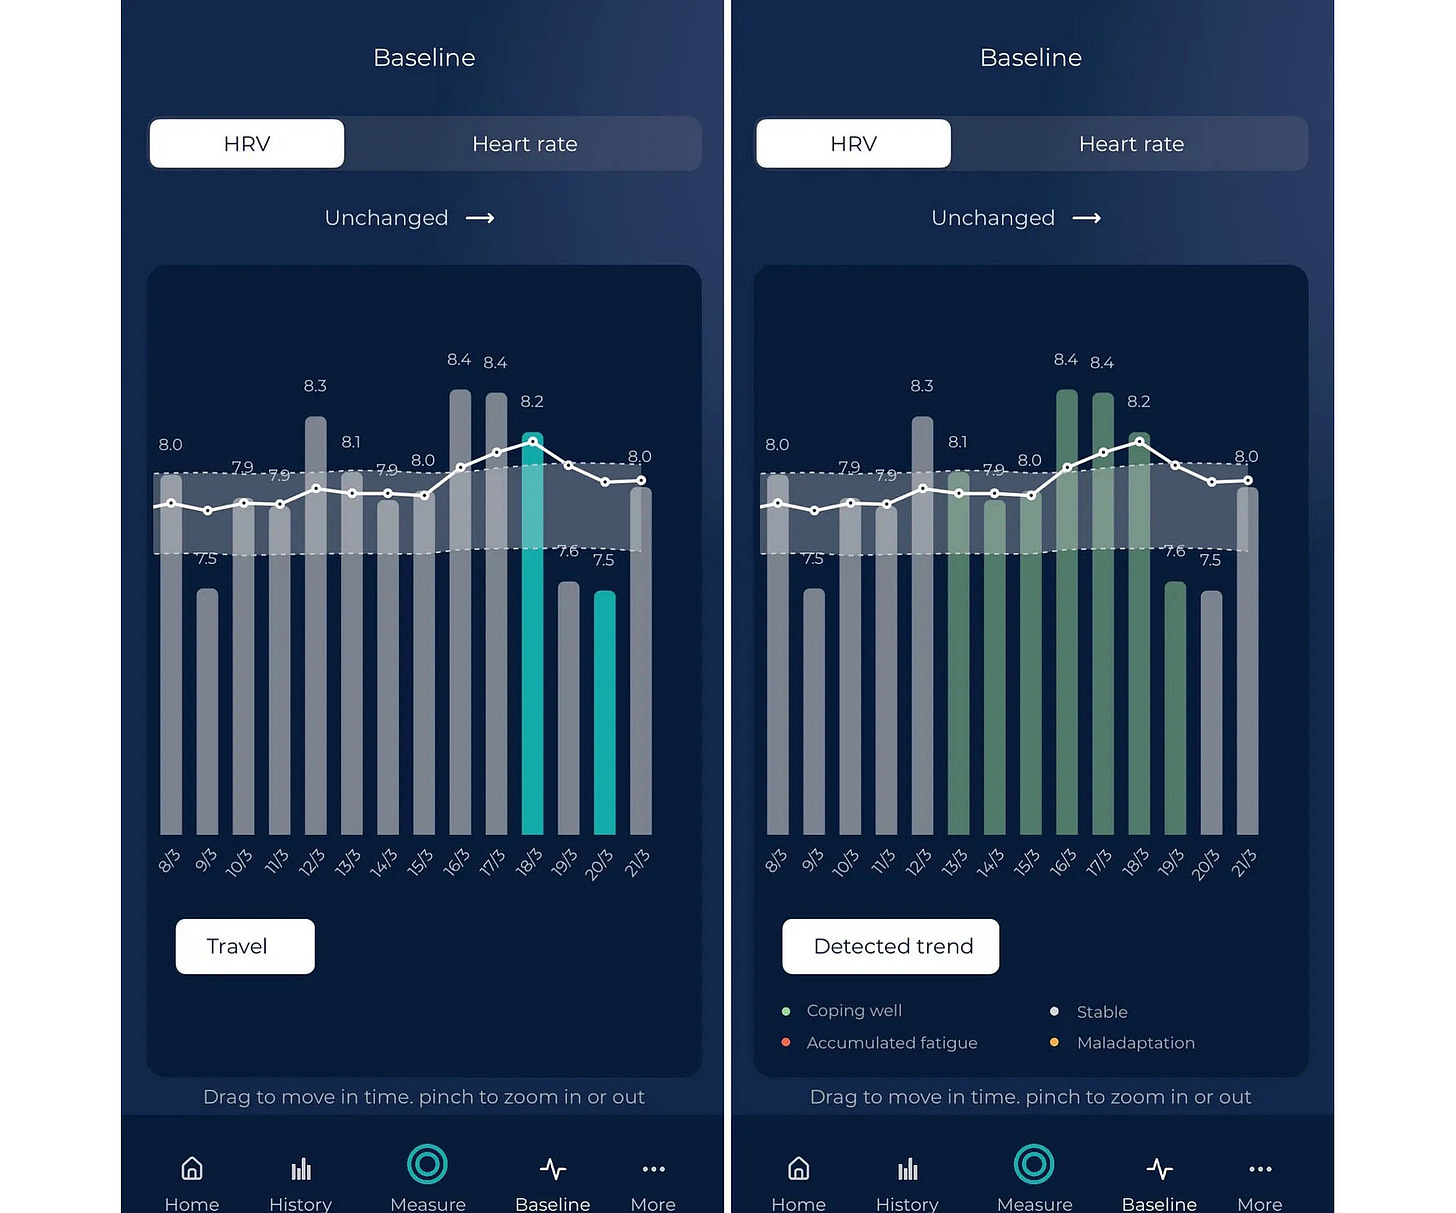
In the long term, once you have used the app for a few months, it can be helpful to visually look at the normal range to better understand the full picture and analyze baseline deviations that highlight longer periods of higher stress. This is what you can do now in the app if you have a Pro account.
Additionally, the app visualization provides color-coded annotations so that it is a bit easier to contextualize stressors in the medium-long term.
Similarly, you can see the normal range on the Pro website online, under the Overview page.
How can you try it?
If you already have HRV4Training, you can try Pro for free by logging in here.
Once you have started your free trial or purchased a plan, the Baseline page of the app will update automatically.
Wrap up
Using HRV requires a mindset shift: from higher is better, to normal is better.
While many tools out there started converting your physiological and behavioral data into 0 to 100 scores, physiology does not work that way.
Use a tool that can establish your normal range and clearly shows you when day-to-day and weekly changes are outside of your normal range, to make the most of the data.
A stable, within-normal HRV is ideal, as I discuss here.
I hope this was informative, and thank you for reading and for supporting our work.
Ways to Show Your Support
No paywalls here. All my content is and will remain free.
If you already use the HRV4Training app, the best way to support my work is to sign up for HRV4Training Pro.
Thank you!
Coaching
If you are interested in working with me, please learn more here, and fill in the athlete intake form, here.
Marco holds a PhD cum laude in applied machine learning, a M.Sc. cum laude in computer science engineering, and a M.Sc. cum laude in human movement sciences and high-performance coaching.
He has published more than 50 papers and patents at the intersection between physiology, health, technology, and human performance.
He is co-founder of HRV4Training, advisor at Oura, guest lecturer at VU Amsterdam, and editor for IEEE Pervasive Computing Magazine. He loves running.
Social:




Thanks Marco! Yes I use the strap as it's easy enough to do and I don't have any repeat requests :)
Brand new user of HRV4Training. Without trying to over interpret the initial numbers, I don't know what my 5 day HRV of 6.8 means and my rMSSD being below 20 seems low. I'm sure this will all make sense with more data collected but is rMSSD below 20 concerning for a 71 year old ultra runner?