[TrainingTalk] Tracking Progress in Endurance Training
a few tools I've built over the years, available in HRV4Training Pro
Over the years, mostly because of frustration with what was available out there, I’ve built different tools to help endurance athletes track progress with their training. In particular, it should be clear by now that we are unable to track progress effectively using training load analysis tools (e.g. chronic training load based on TRIMP or TSS, or any other metric), and that we need to look at progress from different angles, and with different tools.
Here are three analysis that I’ve built in HRV4Training Pro and that I find useful in different ways, which I will explain below:
Interval analysis: I use this to compare different sessions, especially when doing VO2max or threshold blocks, when I often do the same sessions (e.g. 800m reps, or 2-3km reps). While we don’t expect progress each session, over a few weeks or months, things should trend in a clear direction (equally informative if they don’t!).
Lactate threshold estimation (LT2, or critical pace/speed): I keep track of this estimate throughout my training, as it is also indicative of what I can race in shorter distances, or what I should aim at in terms of intervals speed. This is a prediction model I built to estimate running performance based on workouts data collected during the previous 4–6 weeks. You can find the paper here. While for low-intensity exercise I find internal load to be the most useful data (e.g. heart rate and potentially lactate, see also this blog), I prefer to use external load as an indicator of higher-intensity effort pace or race pace.
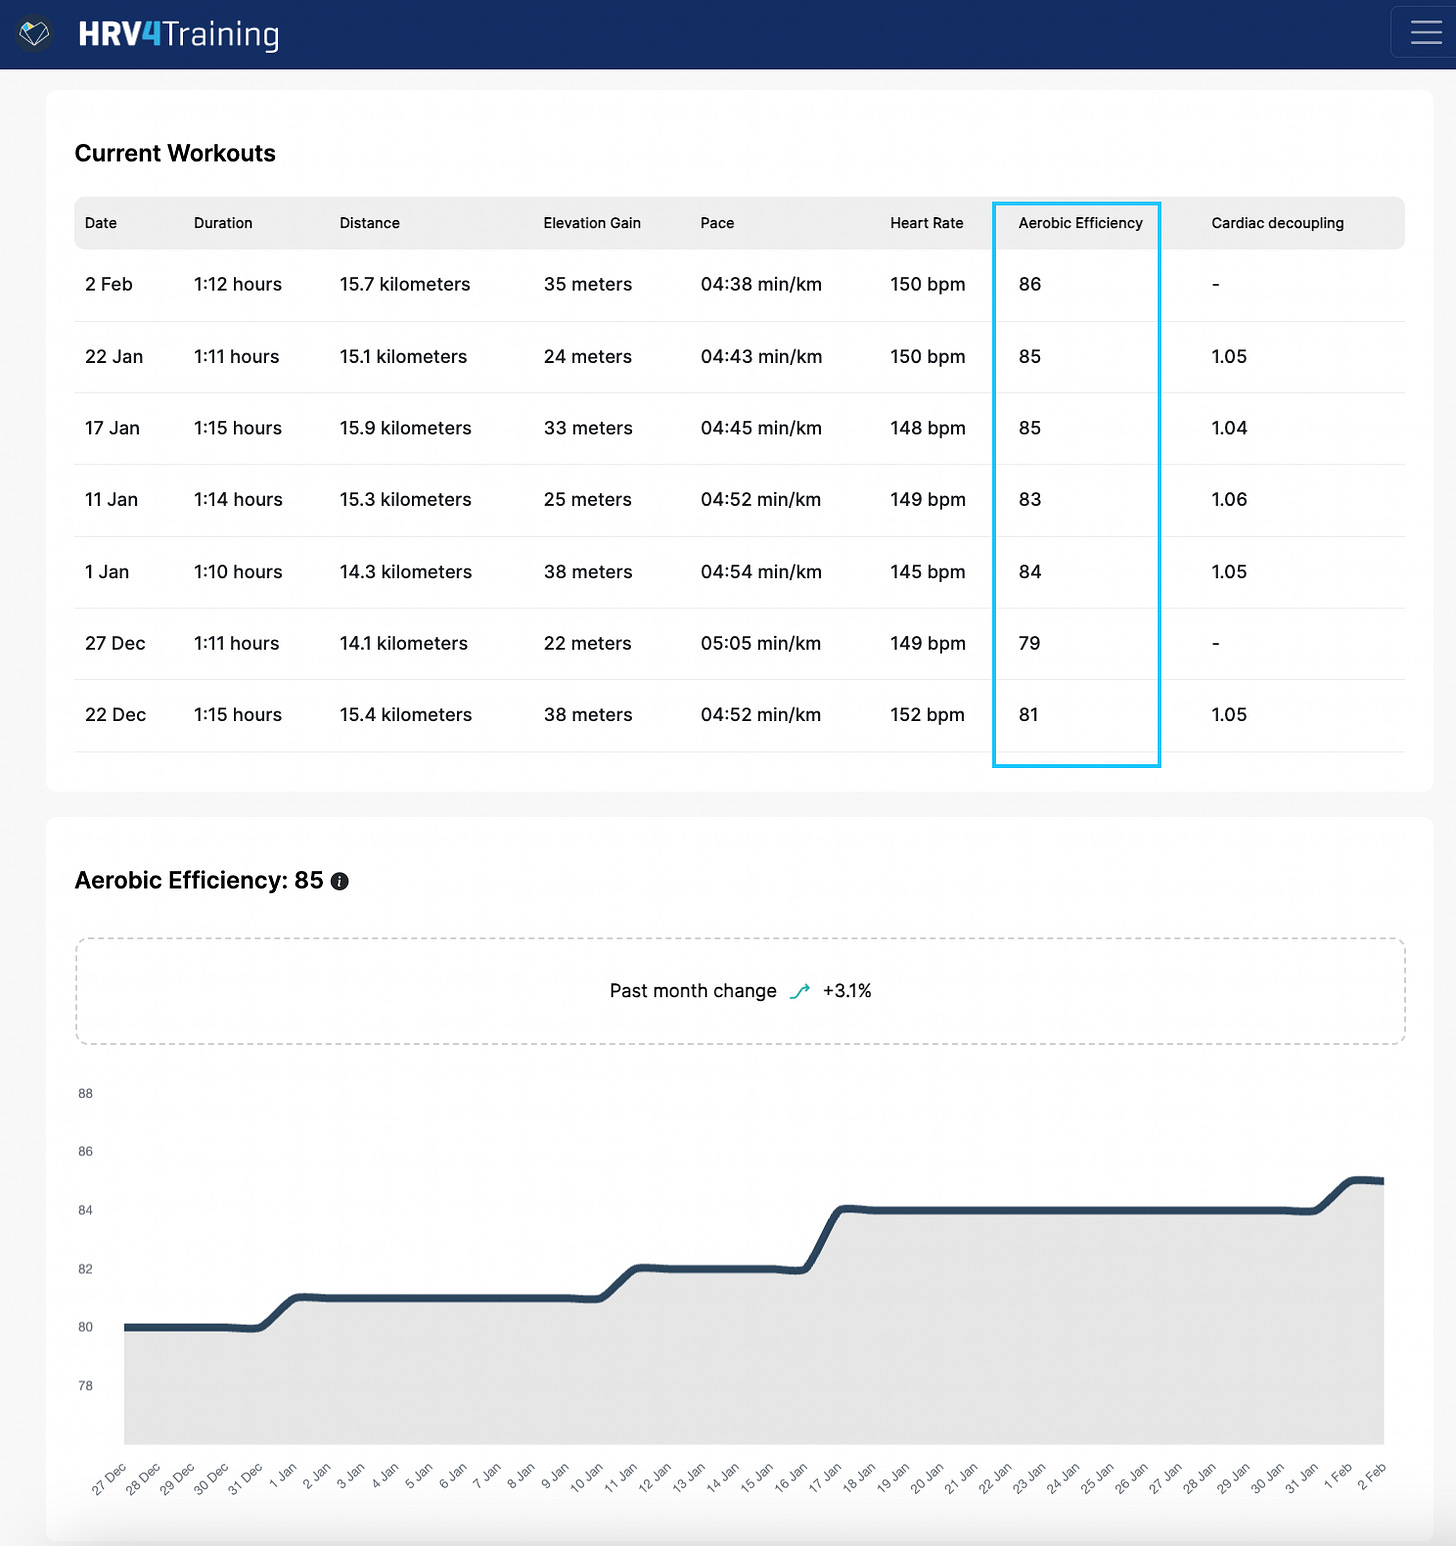
Aerobic efficiency: I use this in the medium and long term to see if there are any meaningful changes in internal load with respect to external load, removing confounders (i.e. answering the question: is it getting easier to run faster?). I also use it in the short term to see the effect of e.g. environmental stressors, fatigue, etc.
Let’s look at these three analysis in more detail.
Intervals analysis
HRV4Training’s Pro Intervals Analysis tool makes it very easy to compare sessions. To use this tool, you need HRV4Training Pro + Strava, so that your laps will be logged automatically, and you just need to select the duration of the hard and recovery phases. More info here.
In particular, you can pick the following:
The timeframe on which to perform the analysis
Sport to analyze (at this stage only running or biking)
The main metric to use for the analysis of the hard part (distance, e.g. if you run 400m reps, or time if you run or ride for 2' reps)
The main metric to use for the analysis of the easy part, which can also be set to any if you have variable or unspecified recoveries.
Then the analysis will show you the number of reps, average duration, speed or pace, and heart rate or power data. This way you can easily track improvements (or lack thereof) over time.
Lactate threshold estimation (or critical pace / speed)
Another tool I built to track progress is what we call lactate threshold estimation in HRV4Training (here I refer to the second threshold, or the intensity you should be able to hold for 10–15 km).
This is in fact a running performance estimation model, that you could think of in terms of critical speed or pace. Check this paper for more details on how we built this model.
In practical terms, the model uses your workouts data, hard sessions, and short races, to estimate your 10 km running time, and convert it to a pace.
The lactate threshold (or critical pace in this context), is approximately the pace you should be able to hold for a distance between 10 and 15 km. This is the criteria used in HRV4Training, which should help you make sense of the estimate. The top panel shows your current lactate threshold (past 3 to 6 weeks depending on available data) and the relative change with respect to the previous 2 months. The side panels show the most likely range in which your current lactate threshold is, consider our estimation model error.
Intuitively, knowing your lactate threshold can help you define pacing strategies for racing events between the 5 km and the half marathon (or longer, but in that case, other factors such as training volume or running economy start to play a more important role), as well as determining training pace for intervals and tempo runs.
HRV4Training Pro provides pace zones as reported below, as well as estimates for your half-marathon and marathon times.
Aerobic efficiency
Aerobic efficiency relates to your ability to sustain a given workload. Good endurance athletes tend to have high aerobic efficiency, meaning that they can sustain a relatively high workload (for example pace or power), at a relatively low effort (typically measured in terms of heart rate).
To determine your aerobic efficiency you can compute the relation between output (pace or power) and input (heart rate). Intuitively, a lower heart rate for the same output (pace or power), when consistently shown over periods of weeks, translates into better aerobic endurance.
Similarly, a higher power or faster pace at the same heart rate is linked to improved aerobic efficiency. By analyzing the relationship between input and output for running or cycling activities, you can easily track aerobic efficiency changes over time, as you progress with your training. Note that there is no ideal (absolute) value when it comes to aerobic efficiency, the whole point is to track progress relative to your historical data and to see how training is progressing.
Below is an example in which I have filtered for zone 2 efforts, as I ran the same route once per week for several weeks, while rebuilding with my training. The analysis captures progress in terms of a faster pace for the same heart rate, in this case:
While aerobic efficiency is in arbitrary units, it can be interesting to see how things change in the medium or long term (these changes would show how cardiorespiratory fitness changes, as in the image above), but also acutely after an effort (these changes reflect fatigue). For example, below, after a marathon, we can see that my aerobic efficiency is reduced for the following day’s run, as I am sore and more fatigued, but things improved already the day after, getting closer to the "fresh state" of the race.
You can find the actual data here on my Strava.
More info about aerobic efficiency, here.
What do you need to use these features?
A Strava account linked to HRV4Training.
HRV4Training Pro, which you can try here, if you already use the app.
Doing the training.
Wrap up
Combining these three analyses, I can track how performance is changing without doing any specific performance tests.
We can look at how things are going over shorter intervals, if our critical speed or second threshold is improving (also based on workouts performance), and we can determine if our aerobic efficiency is improving as well, which tends to be tightly coupled to our cardiorespiratory fitness level.
Note that when looking at training load, none of this is visible. Training load analysis can be helpful to manage load (e.g. maybe to increase load gradually), but does not track progress in any way unless you just exercise more, which might not be what you need to get faster or what is even possible to do after the first few years of training.
I hope you can find these tools useful, and all the best for your training!
Marco holds a PhD cum laude in applied machine learning, a M.Sc. cum laude in computer science engineering, and a M.Sc. cum laude in human movement sciences and high-performance coaching.
He has published more than 50 papers and patents at the intersection between physiology, health, technology, and human performance.
He is co-founder of HRV4Training, advisor at Oura, guest lecturer at VU Amsterdam, and editor for IEEE Pervasive Computing Magazine. He loves running.
Social:


