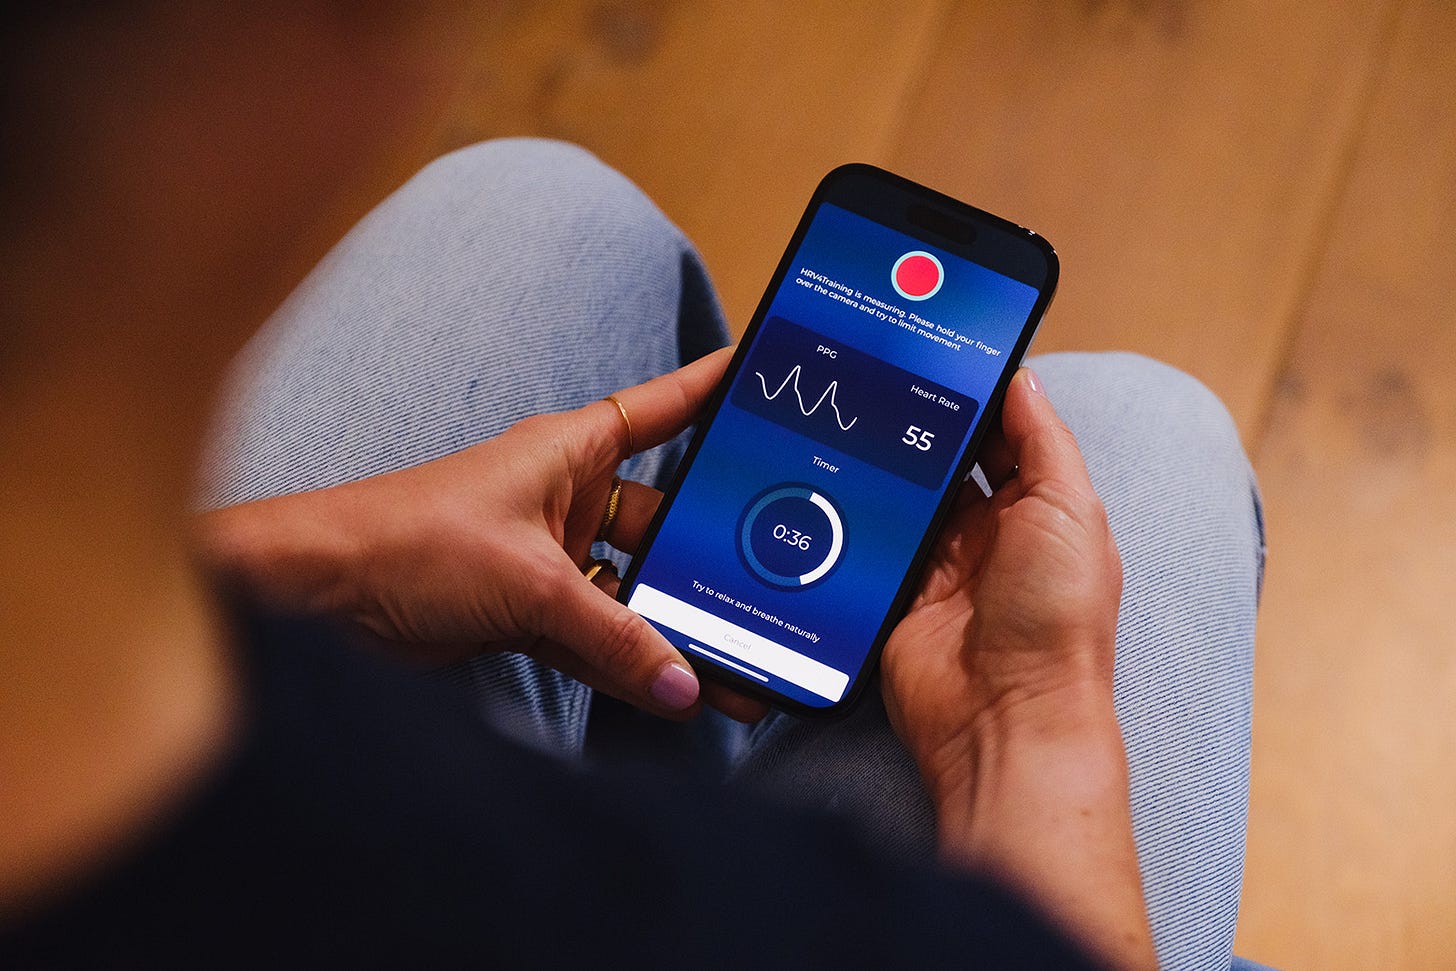
In this blog, I cover a few features that you might not know about, but that could be helpful in a number of situations:
1. Re-reading data from Strava or other linked services for a given day, or editing your questionnaire for a given day. Something useful in case you were offline or didn’t have time to measure.
2. Hiding your data permanently or just for today. Something useful on race day or periods in which you’d like to track but not see the data.
3. Setting up custom tags. Something useful when there are aspects of your life that are not captured by the standard questionnaire and you’d like to investigate more in relation to resting heart rate or HRV.
4. Manual input. Something useful when you track your HRV with another sensor, but would like the data to be interpreted according to best practices in the scientific literature, as we do in HRV4Training.
5. Practice mode for camera measurements. Something useful when you get started with the app or get a new phone.
And a few more for Pro users:
1. PRO: enabling rMSSD for the homepage. Something useful if you prefer to look at standard metrics.
2. PRO: enabling the normal range to analyze long-term trends in the Baseline page. Something useful when you have collected a few weeks of data.
3. PRO: looking at the correlation between average RR intervals length and HRV. Something useful to spot parasympathetic saturation or lack of information in HRV data (e.g. when collected in the night).
1. Re-reading data from Strava or other linked services for a given day, or editing your questionnaire for a given day
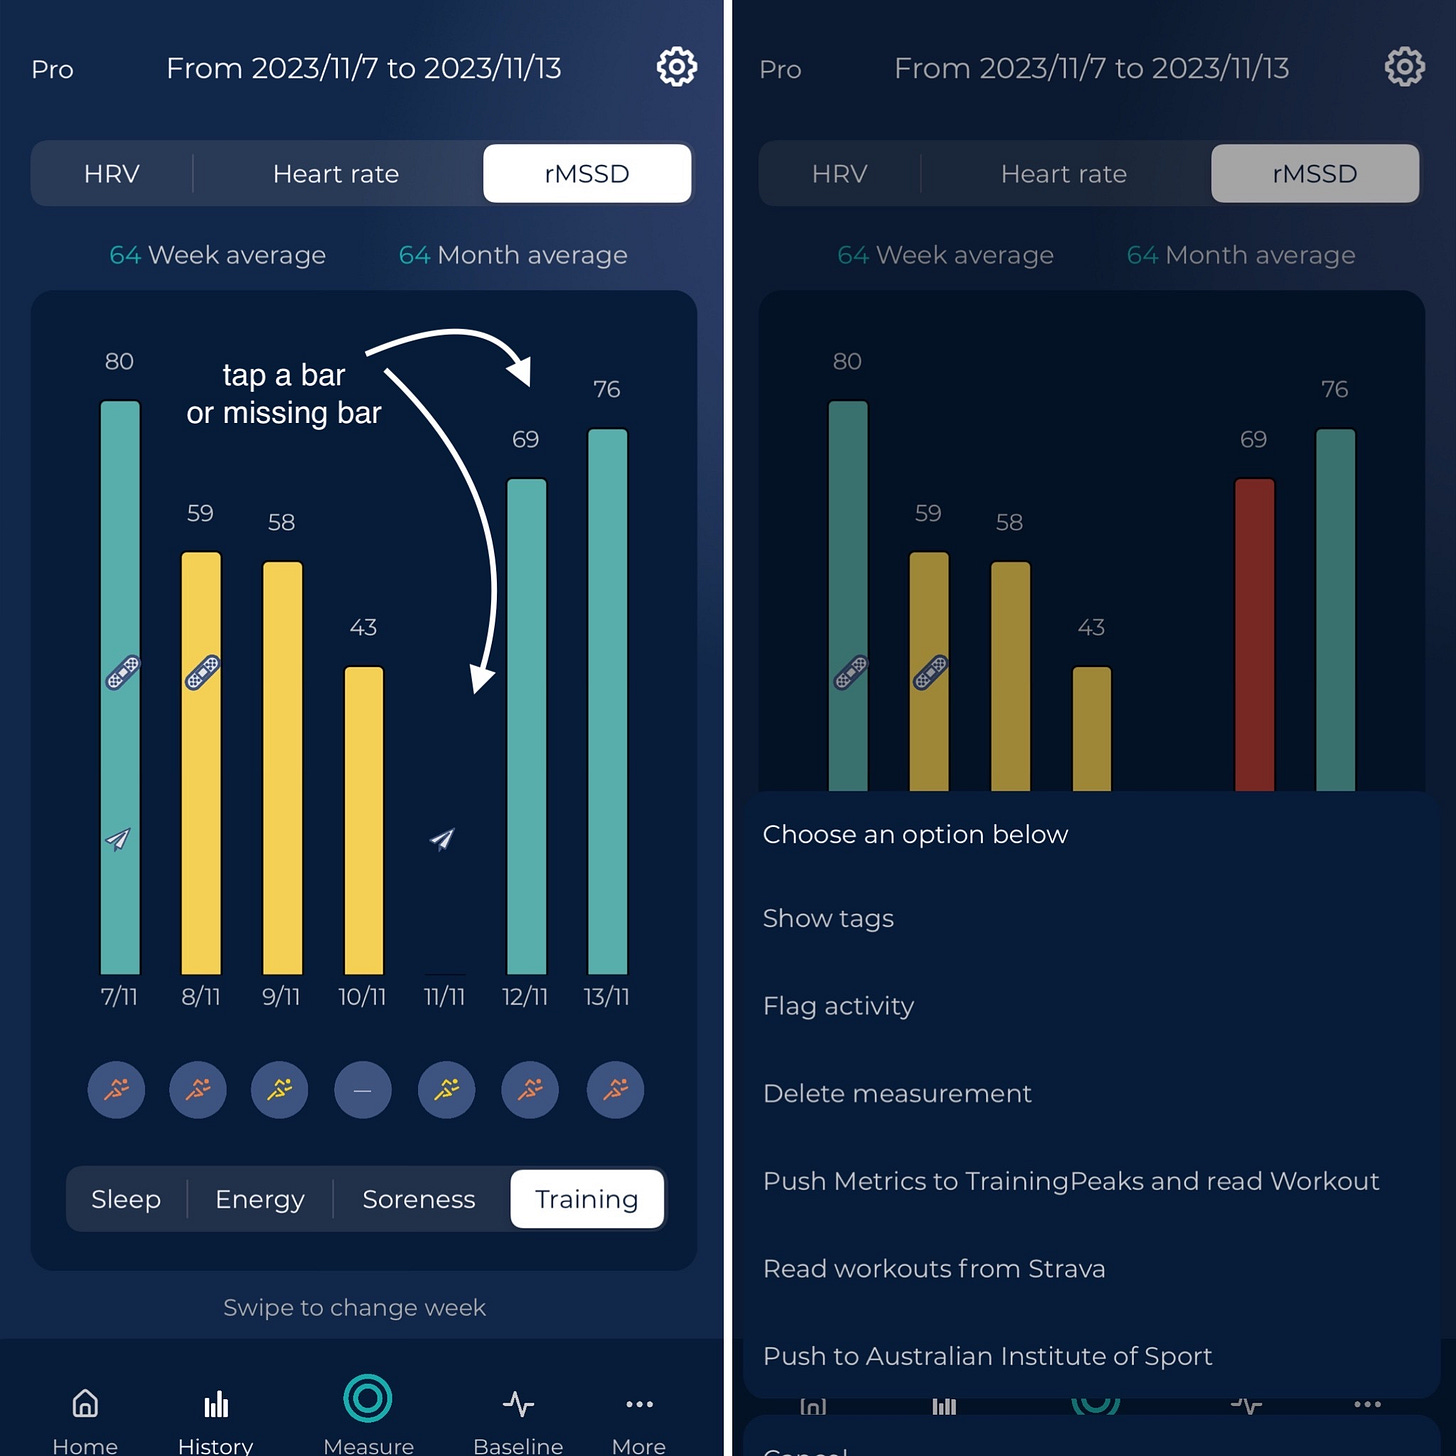
Go to History and tap the measurement bar, a menu will show up. If you did not measure that day, simply tap the missing measurement bar, and the same menu will appear.
Something useful in case you were offline or didn’t have time to measure.
2. Hiding your data permanently or just for today
To hide your data permanently, de-select the “Show daily advice message” control in the Settings page:
To hide your data only for today, when filling in the questionnaire, in the Training Phase control, pick Competing | Hide HRV. You can enable the Training Phase control from Menu / Settings / Configure TAGS.
Something useful on race day or periods in which you’d like to track but not see the data.
3. Setting up custom tags
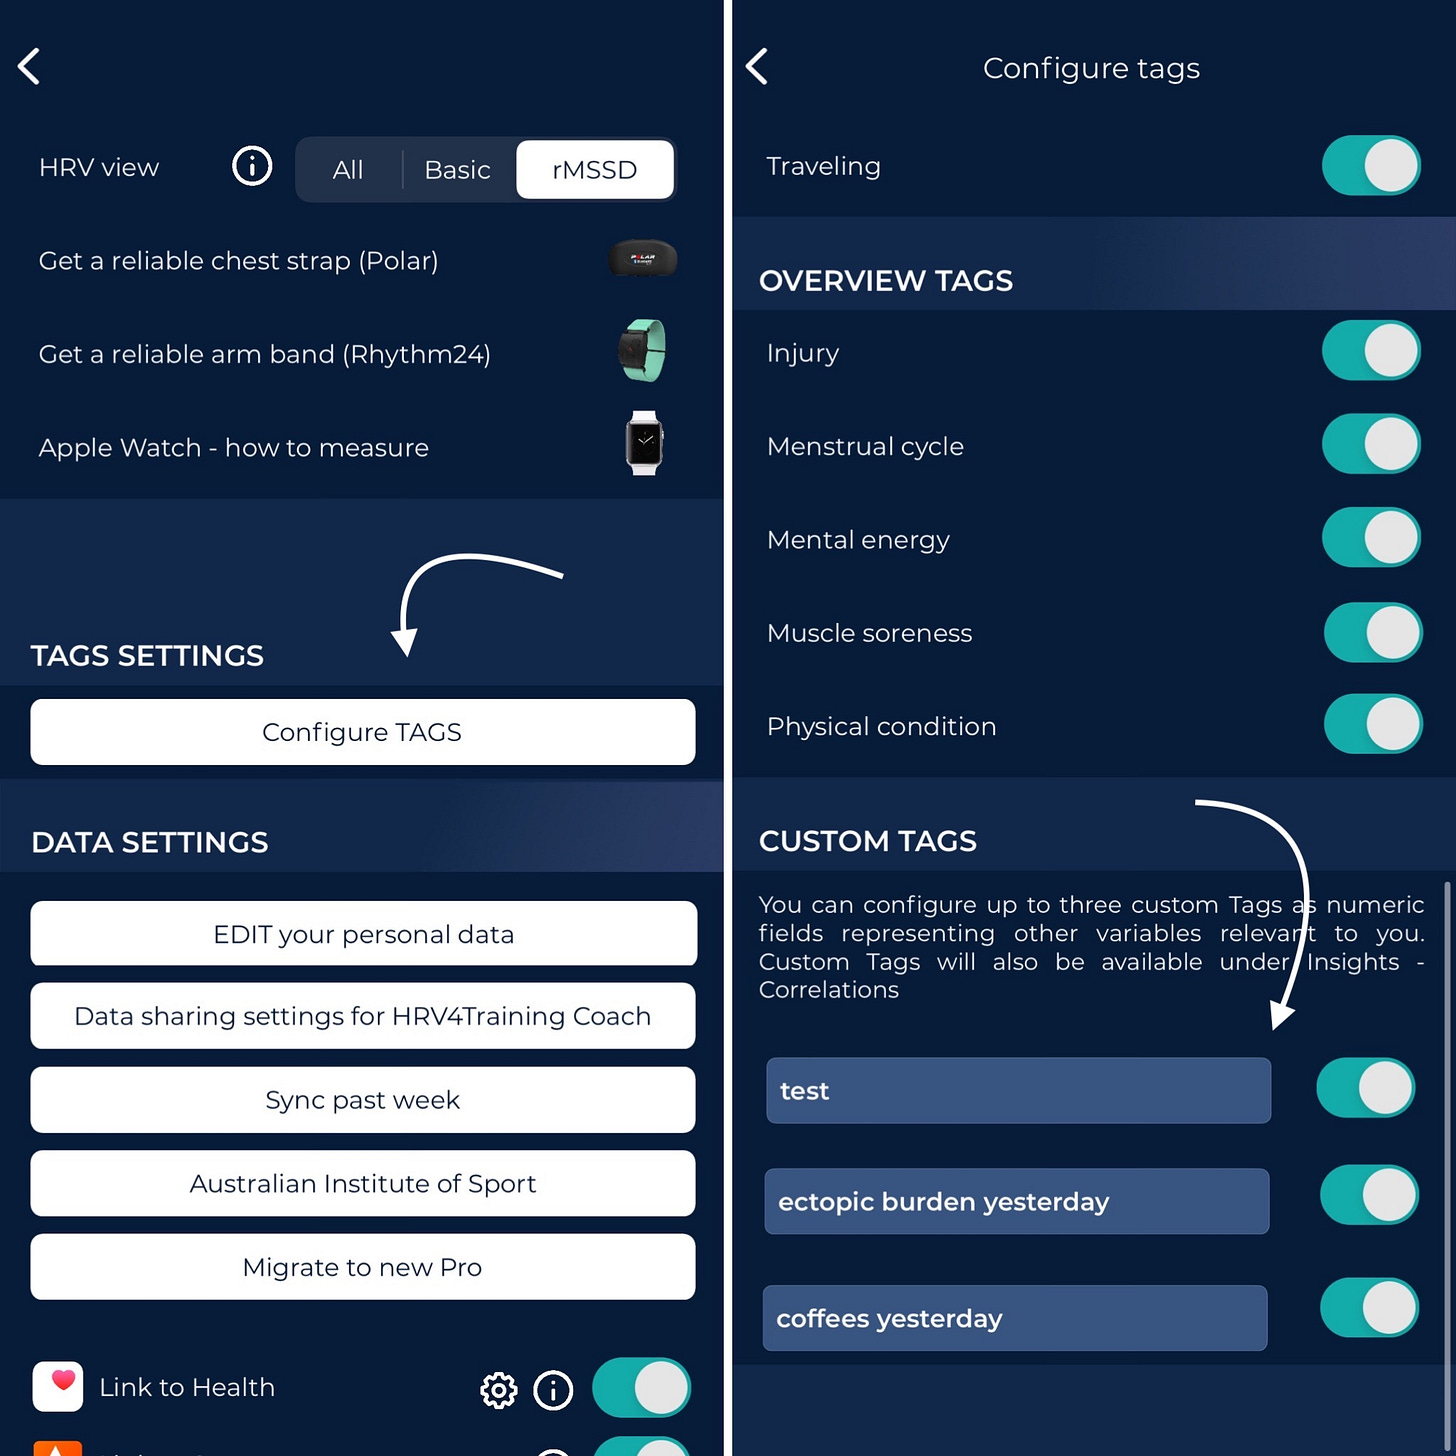
You can set up custom tags from Menu / Settings / Configure TAGS, then scrolling to the bottom of the page. Custom tags are numerical values, hence you can enter the name of the parameter, and then the questionnaire will include numerical fields for such parameters each day.
There are multiple ways to input numeric data. First, you could capture a quantifiable value such as a dose of medication or the duration of a meditation session.
Second, you can code a simple YES-NO answer using 1 = YES and 0 = NO for items where you only want to record whether or not you performed a specific action. Finally, you can use a rating scale of 1-3 to score a potential action.
Custom tags become automatically selectable for your Correlations:
Something useful when there are aspects of your life that are not captured by the standard questionnaire and you’d like to investigate more in relation to resting heart rate or HRV.
4. Manual Input
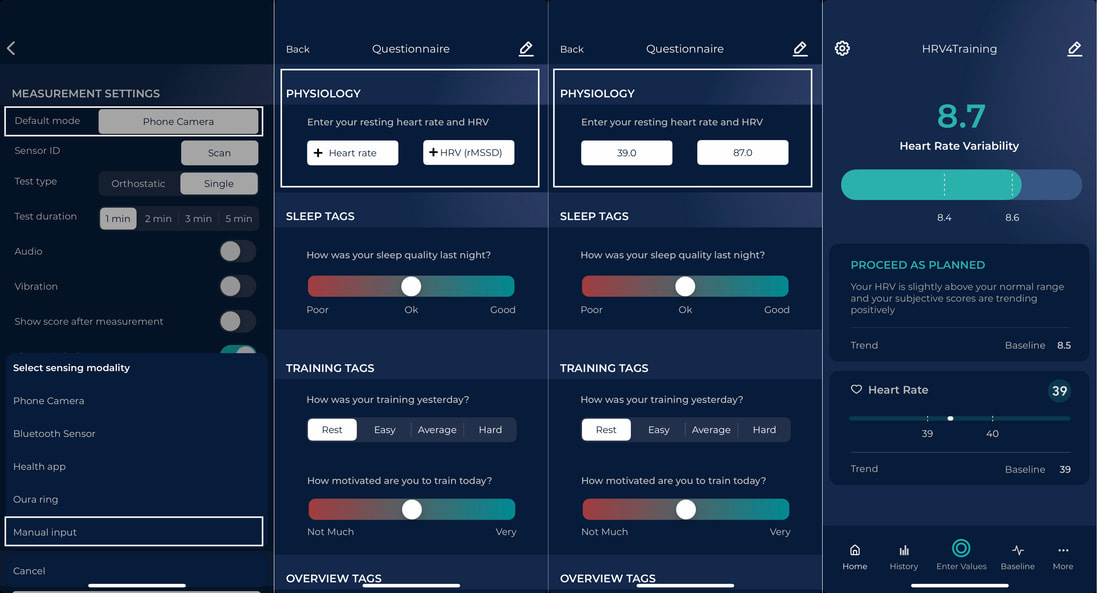
To select manual input, go to Settings and change sensing modality. Then, simply tap "Enter Values" or "Measure" in the homescreen of the app, and the questionnaire will pop up, including an extra section where you can enter your resting heart rate and HRV as reported by another device.
You can also edit your data from History, by tapping a measurement bar and opening the questionnaire for a given day.
More information about manual input is available here.
5. Practice mode for camera measurements
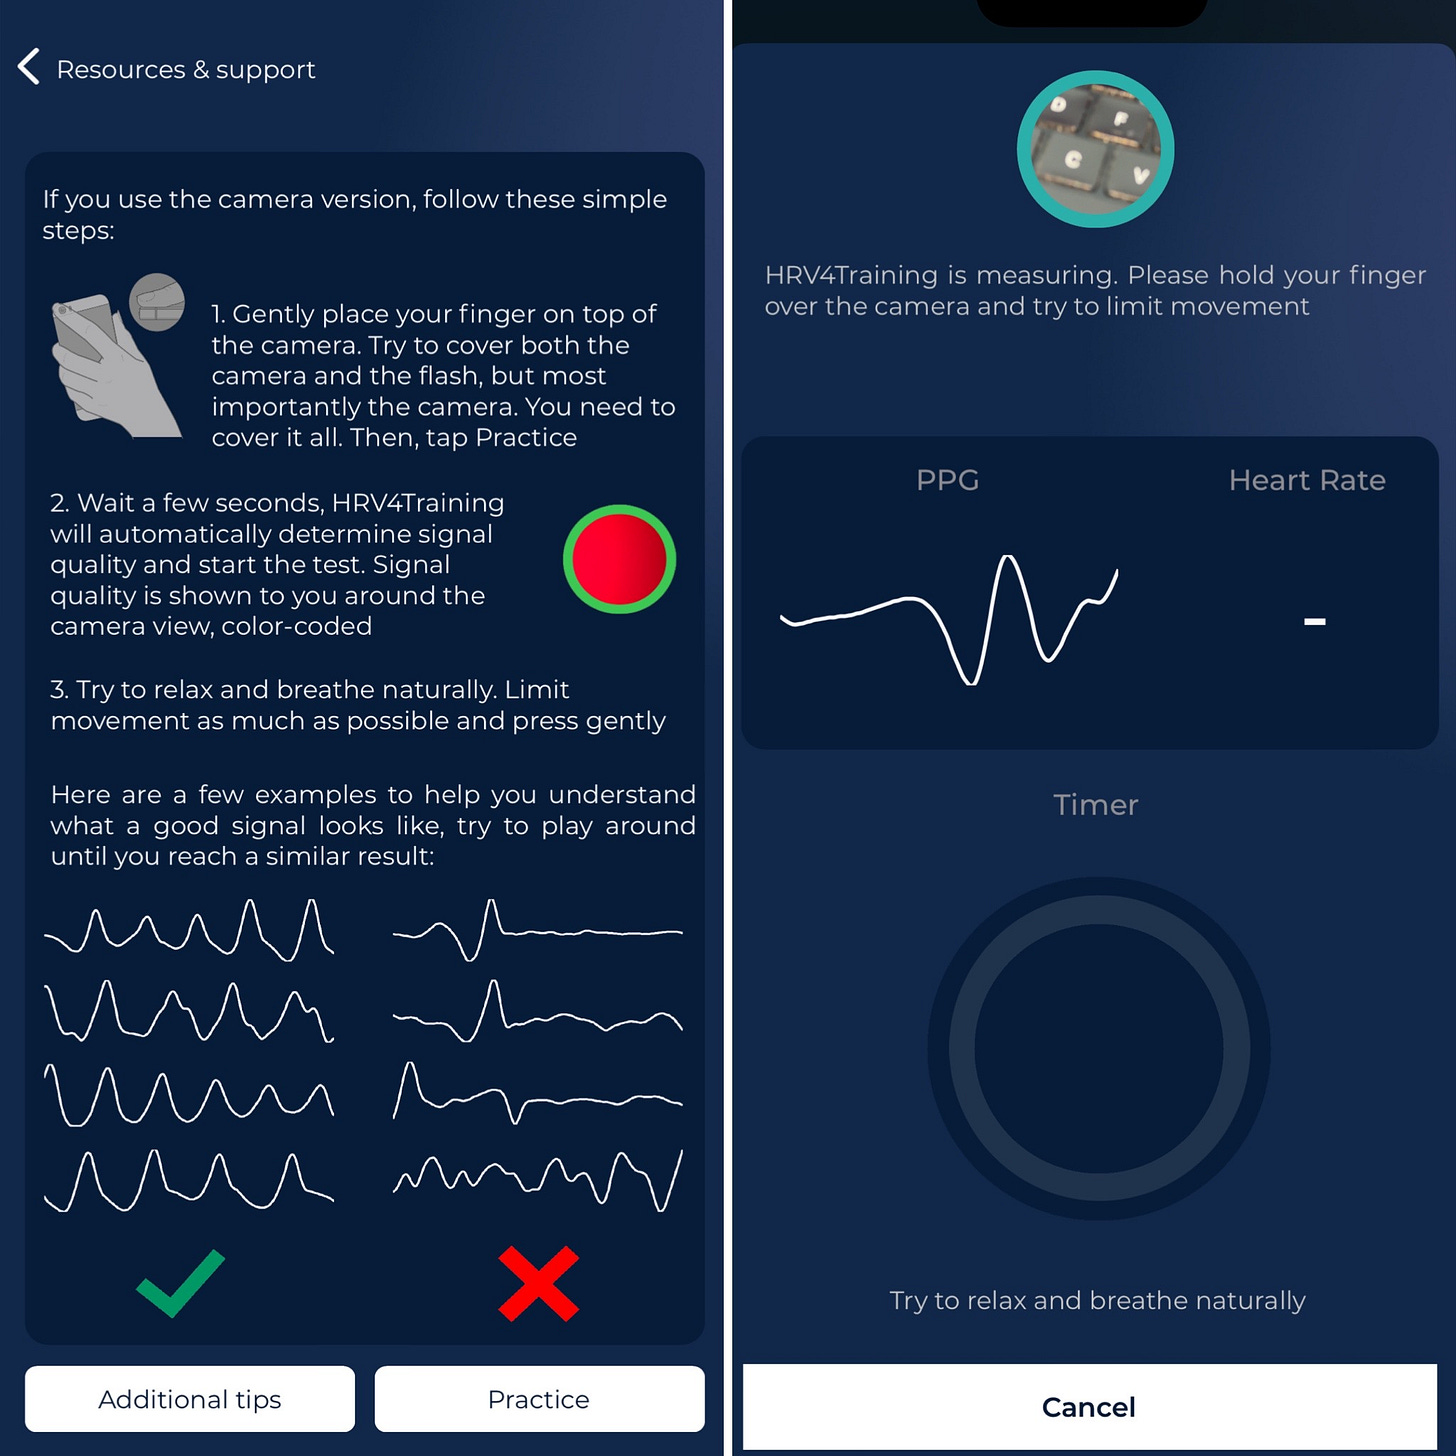
The app will only use one of the cameras to take a measurement.
You can determine which camera is being used by going to the practice mode at Menu / Resources & support / Camera instructions and practice.
In the practice mode when you cover the correct camera the circle that shows what the camera is seeing will turn red. Once you know the correct camera you need to make sure to cover this fully while also covering the flash at least partially with the same finger when you're taking a measurement. Sometimes, covering the camera and just being nearby the flash is sufficient. Practice makes perfect.
And a few more features below, for Pro users.
You can try Pro for free by logging in here: https://hrv4training.web.app
1. PRO: enabling rMSSD for the homepage
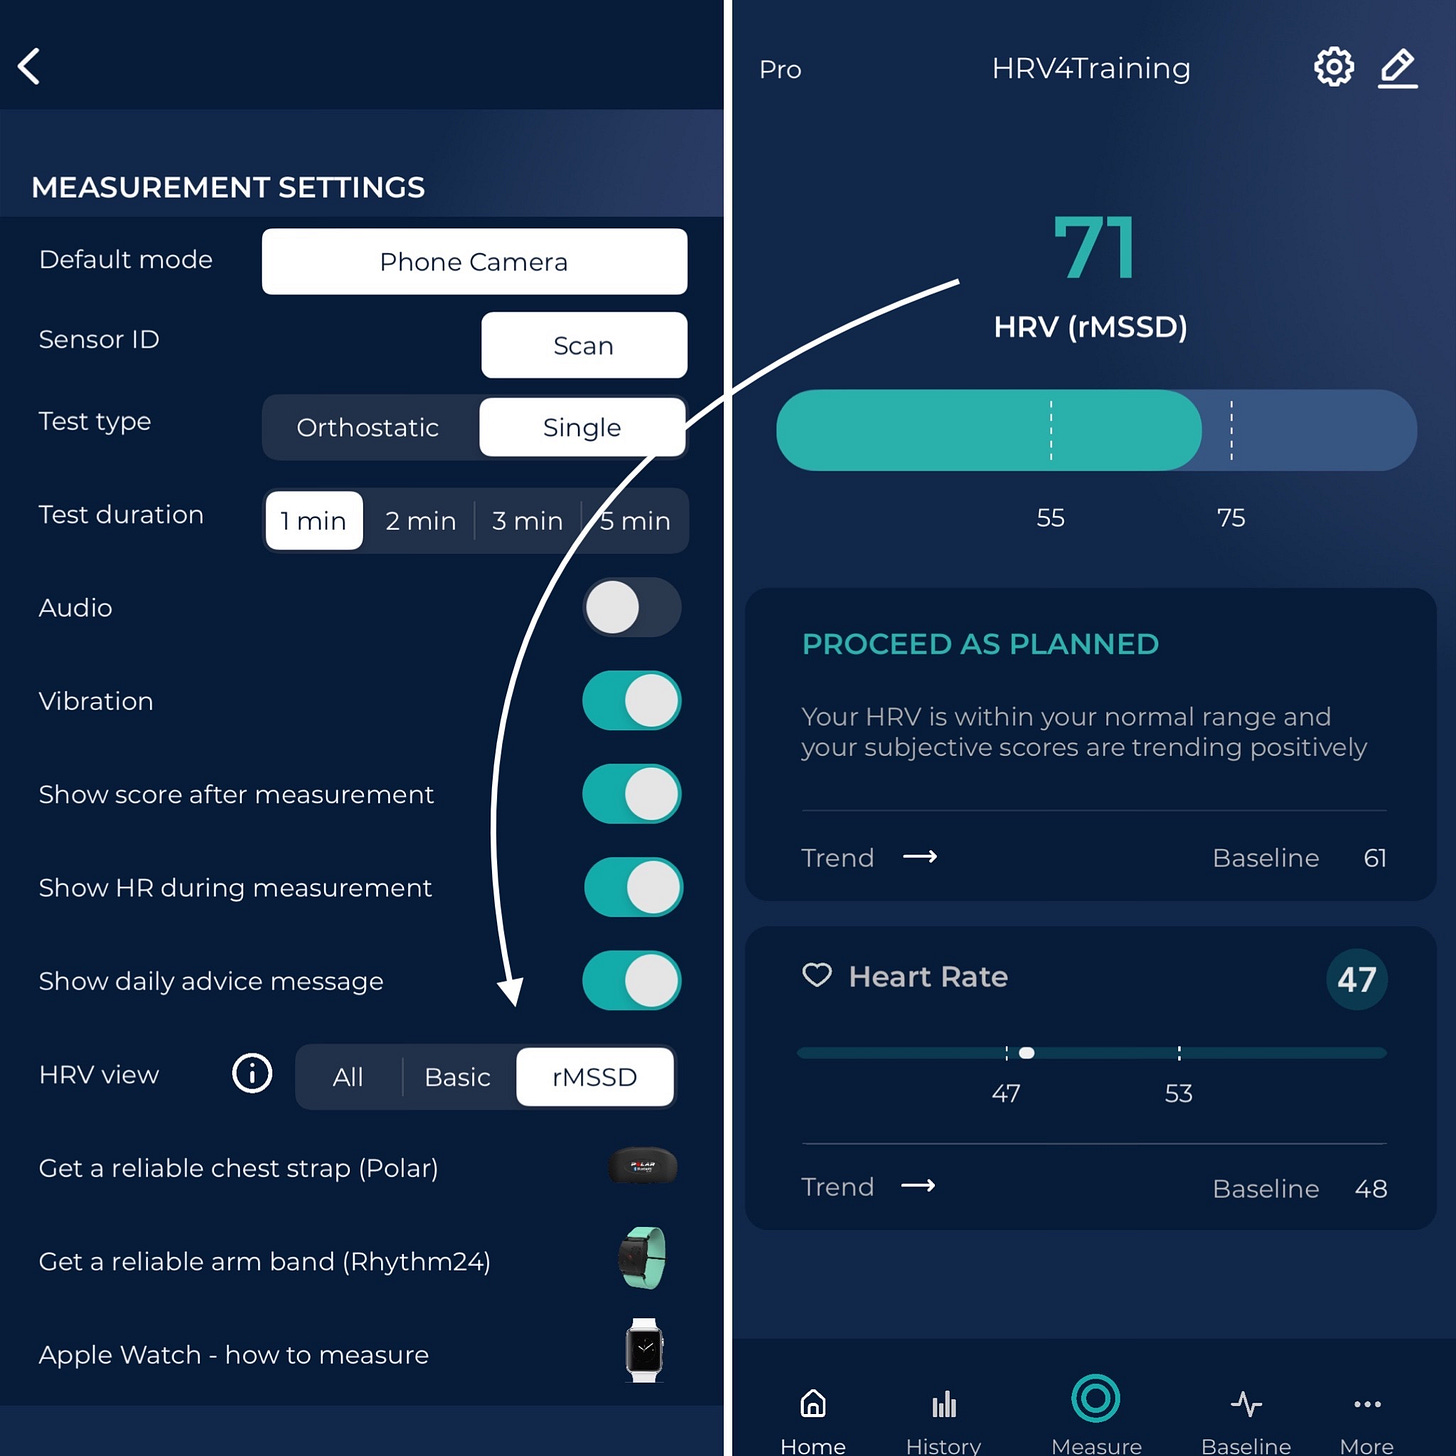
Select rMSSD under Menu / Settings / HRV View, then swipe the homepage.
Something useful if you prefer to look at standard metrics.
2. PRO: enabling the normal range to analyze long-term trends in the Baseline page.
With Pro, the Baseline page will show visually your normal range, and also let you color-code the data based on different parameters:
sickness
alcohol intake
menstrual cycle
daily advice
travel
This way it will be easier to keep an eye on the bigger picture and contextualize your measurement based on annotations and analytics.
Something useful when you have collected a few weeks of data.
3. PRO: looking at the correlation between average RR interval length and HRV.
On the website, under Insights / Resting Physiology, you will find an analysis of the short and long-term correlation between your heart rate and HRV:
If you are in a period of high training load and HRV is low, together with low heart rate, and therefore the correlation between HRV and the average RR interval length is small or negative, parasympathetic saturation is plausible. In the plot above, you would see the darker dots in the lower right corner (low HRV, low heart rate or high RR interval length). In this case, the suppression in HRV should not be interpreted negatively, as reported by Plews et al.: "the lack of correlation between the R-R interval and Ln rMSSD indicate that athletes are more likely to undergo parasympathetic saturation" (something you can learn more about, here).
An alternative use of this feature is to look at how strong the correlation between average RR interval length and HRV gets. If the correlation is near 1, then HRV is not providing any useful information beyond what you get just looking at resting heart rate. This is more common than you’d think, for night data (and one of the reasons why we recommend a sitting measurement in the morning).
Something useful to spot parasympathetic saturation or lack of information in HRV data (e.g. when collected in the night).
I hope you can find these features useful.
You can try Pro for free by logging in here or use code SCIENCE for 20% off any plan.
Marco holds a PhD cum laude in applied machine learning, a M.Sc. cum laude in computer science engineering, and a M.Sc. cum laude in human movement sciences and high-performance coaching.
He has published more than 50 papers and patents at the intersection between physiology, health, technology, and human performance.
He is co-founder of HRV4Training, advisor at Oura, guest lecturer at VU Amsterdam, and editor for IEEE Pervasive Computing Magazine. He loves running.
Social:


