In this blog, I will use some of my recent data to highlight how heart rate variability (HRV) can often be a better marker of our stress response, with respect to heart rate, and also cover some of the reasons why that might be the case, in terms of our physiology.
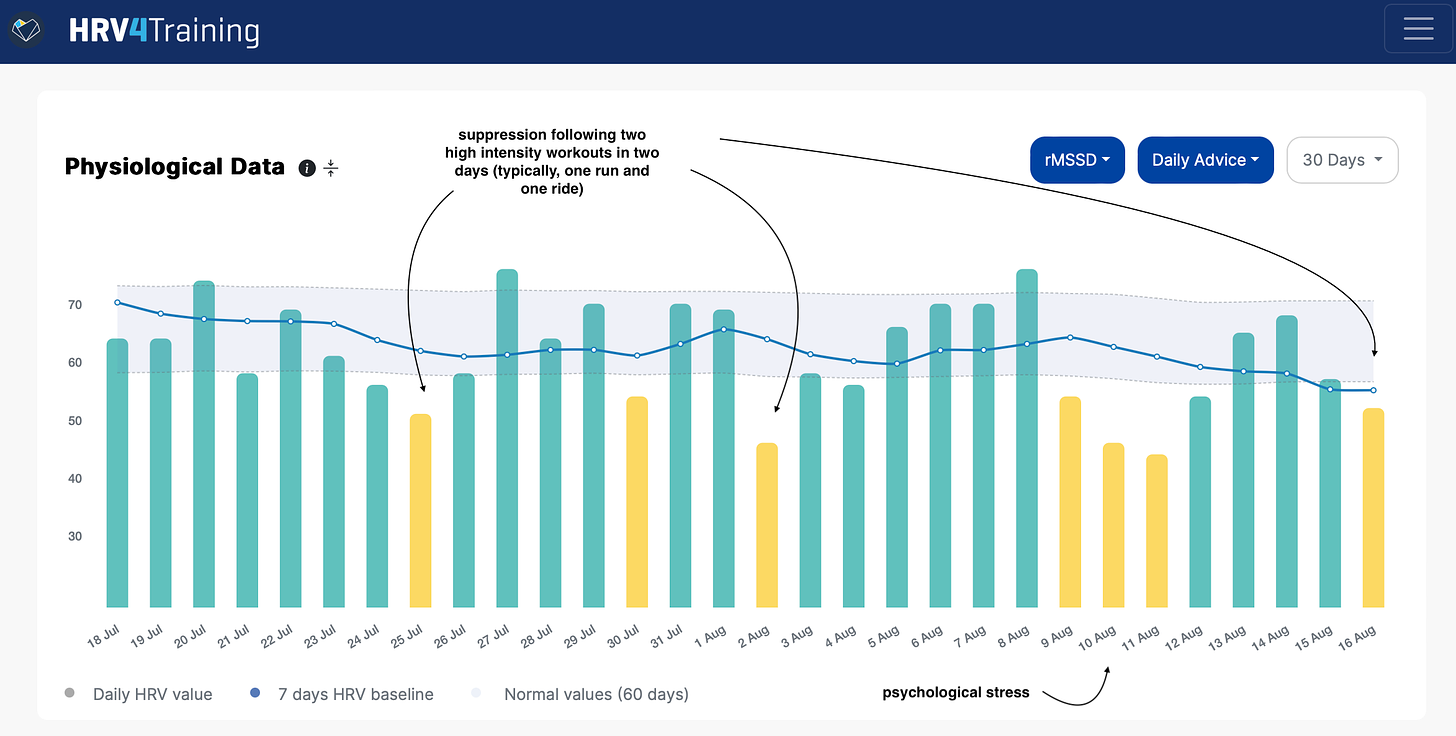
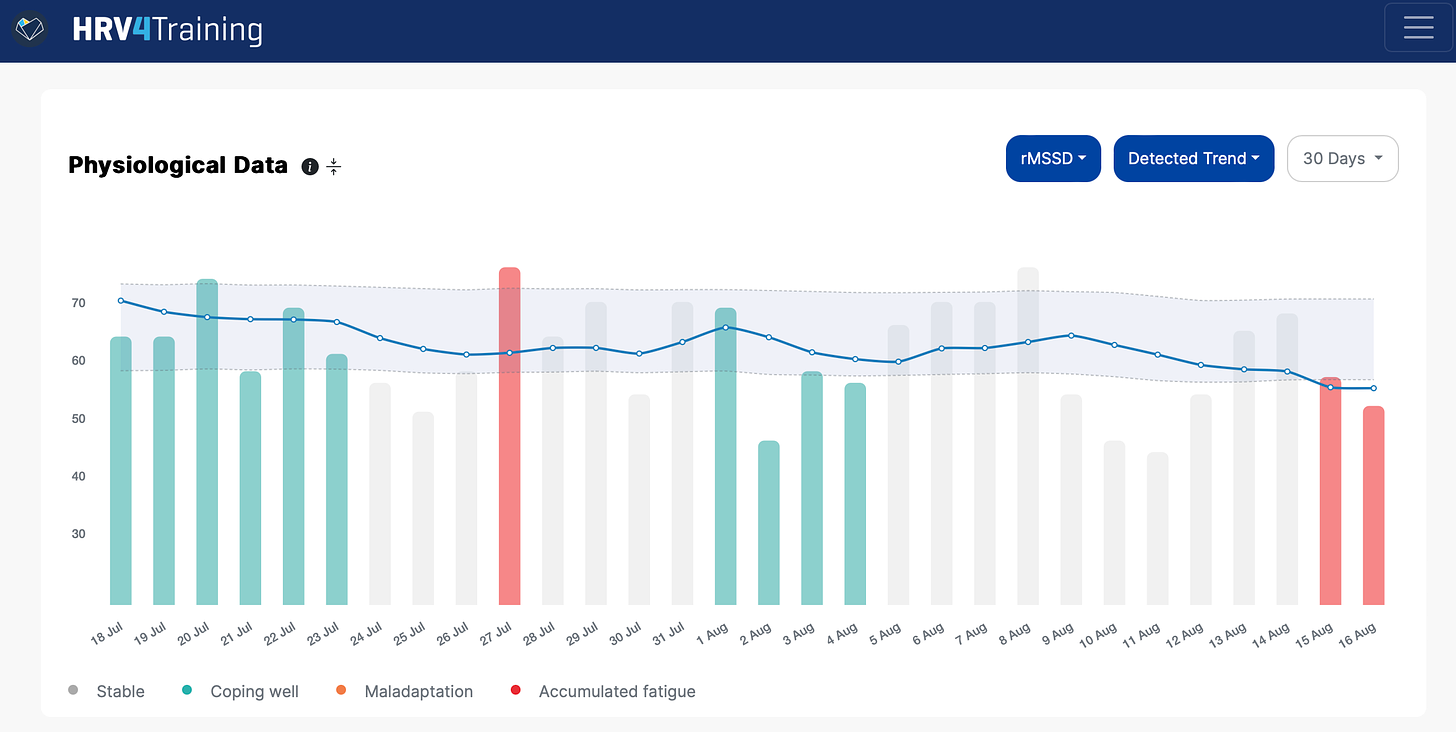
Below is my recent HRV data, showing clear suppressions in response to physical stress (back-to-back days of high-intensity training) as well as psychological stress (long story):
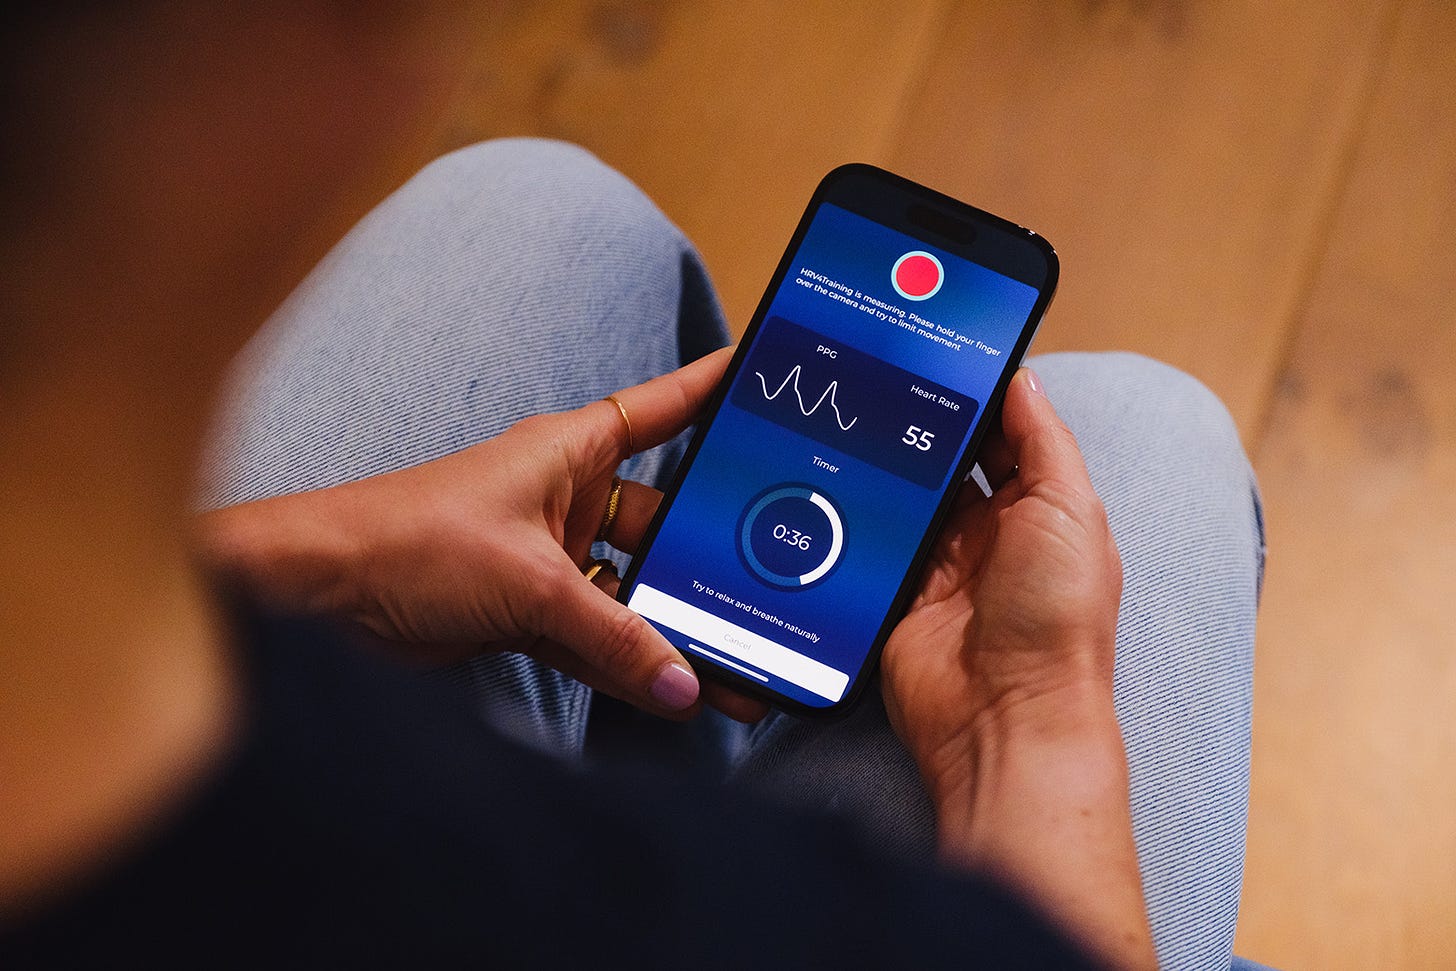
The data is collected daily, first thing in the morning, after going to the bathroom and sitting up, for one minute, using the HRV4Training app (iPhone camera). Check out this blog for more details on best practices for HRV measurements.
I have found the suppression in HRV after two days of high intensity quite systematic, as we can see above (happening every time I did such sessions), as well in some of my past data where these sessions were less frequent. On the other hand, I am currently responding well to a single high-intensity session, which does not lead to a suppression in HRV the following morning.
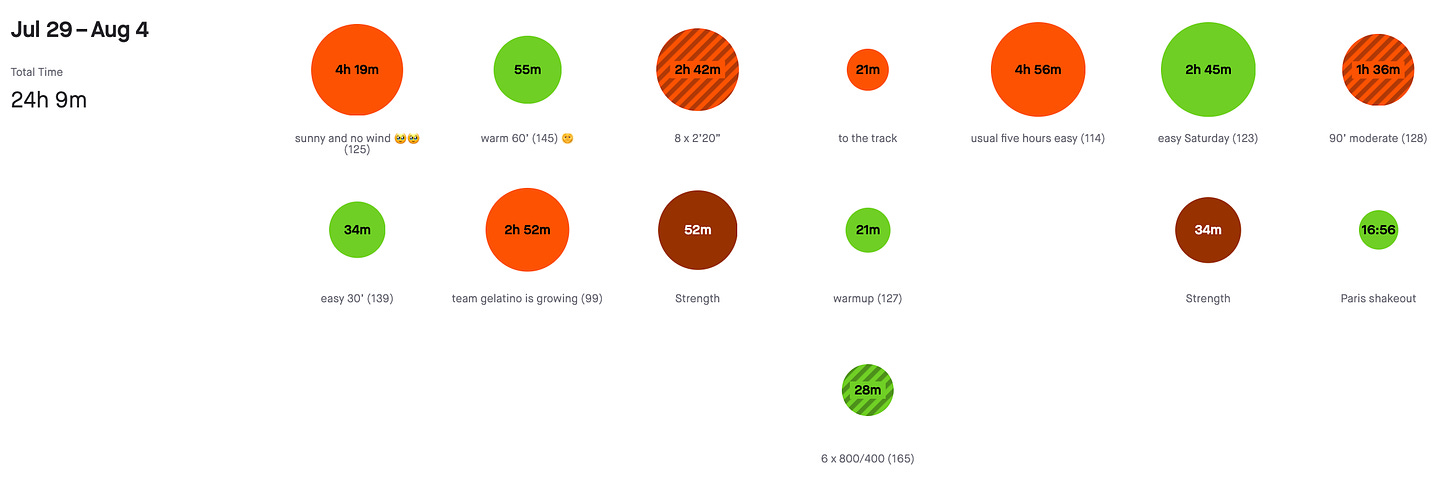
An example week is the following, with the two workouts falling on a Wednesday and a Thursday (full log on my Strava, here):
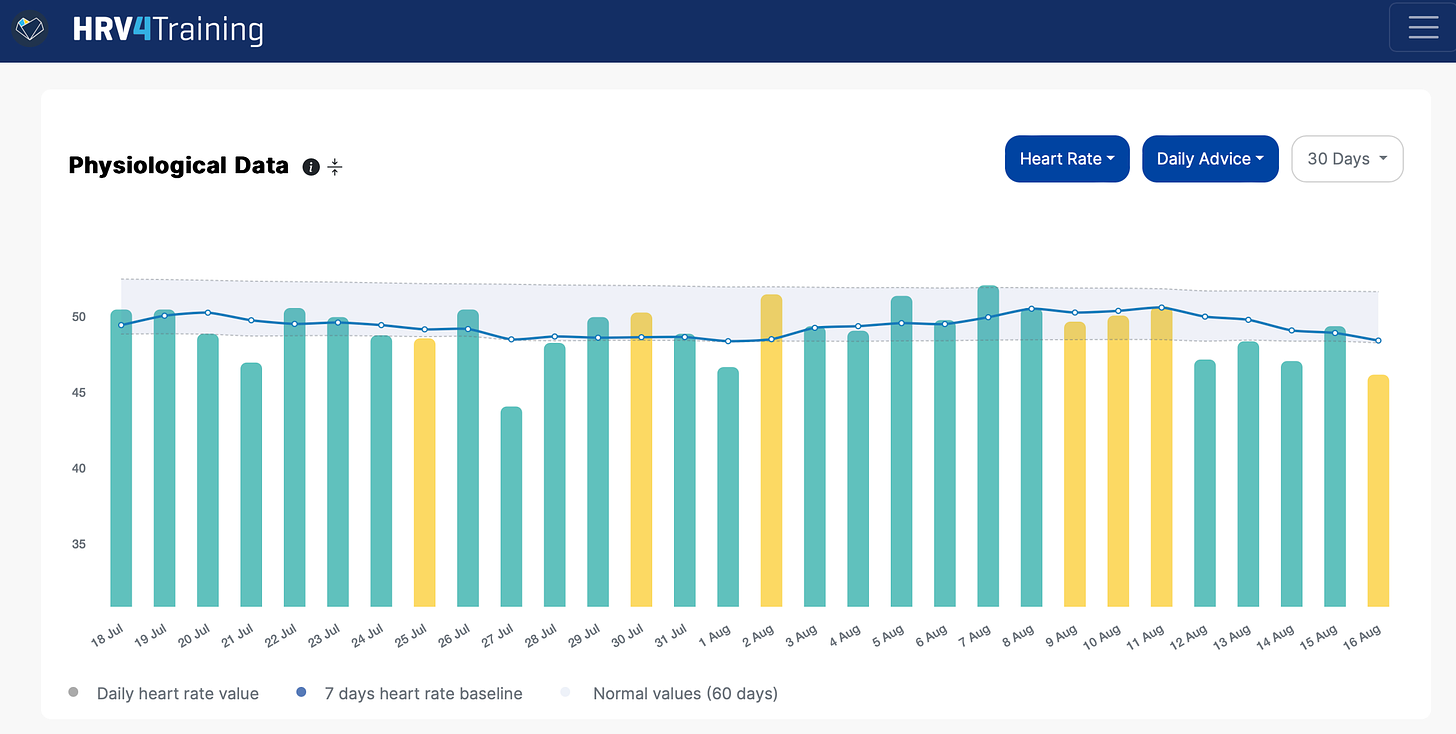
How about heart rate?
None of these changes have been visible in heart rate data.
While I do agree that heart rate data can be useful and easy to track, to me, it remains of very little use outside of situations in which there are obvious issues, e.g. when I am sick (which gladly, doesn't happen much).
We have shown in our research (paper here) and other examples on this blog how HRV tends to be more sensitive to stressors, which is the whole point of measuring our body’s response to things like training and other psychological stressors (let’s move away from sickness and alcohol as the only case studies, please).
Using this data, we can make small adjustments or simply learn from our experience and from how things evolve when we get exposed to similar stressors again in the future. With a quick re-normalization on the following day, I normally do not worry and keep going with my plan. If I wasn’t bouncing back, I’d reconsider my program.
While my response looks like it’s the same every time I do these back-to-back sessions, in reality, the stimulus has increased, from ~25 minutes of intensity in the first week, to 50 minutes of intensity in the last instance. Hence, I expect my response to still be challenged (and indeed we see a suppression), as I am not applying the same stimulus, but a stronger one.
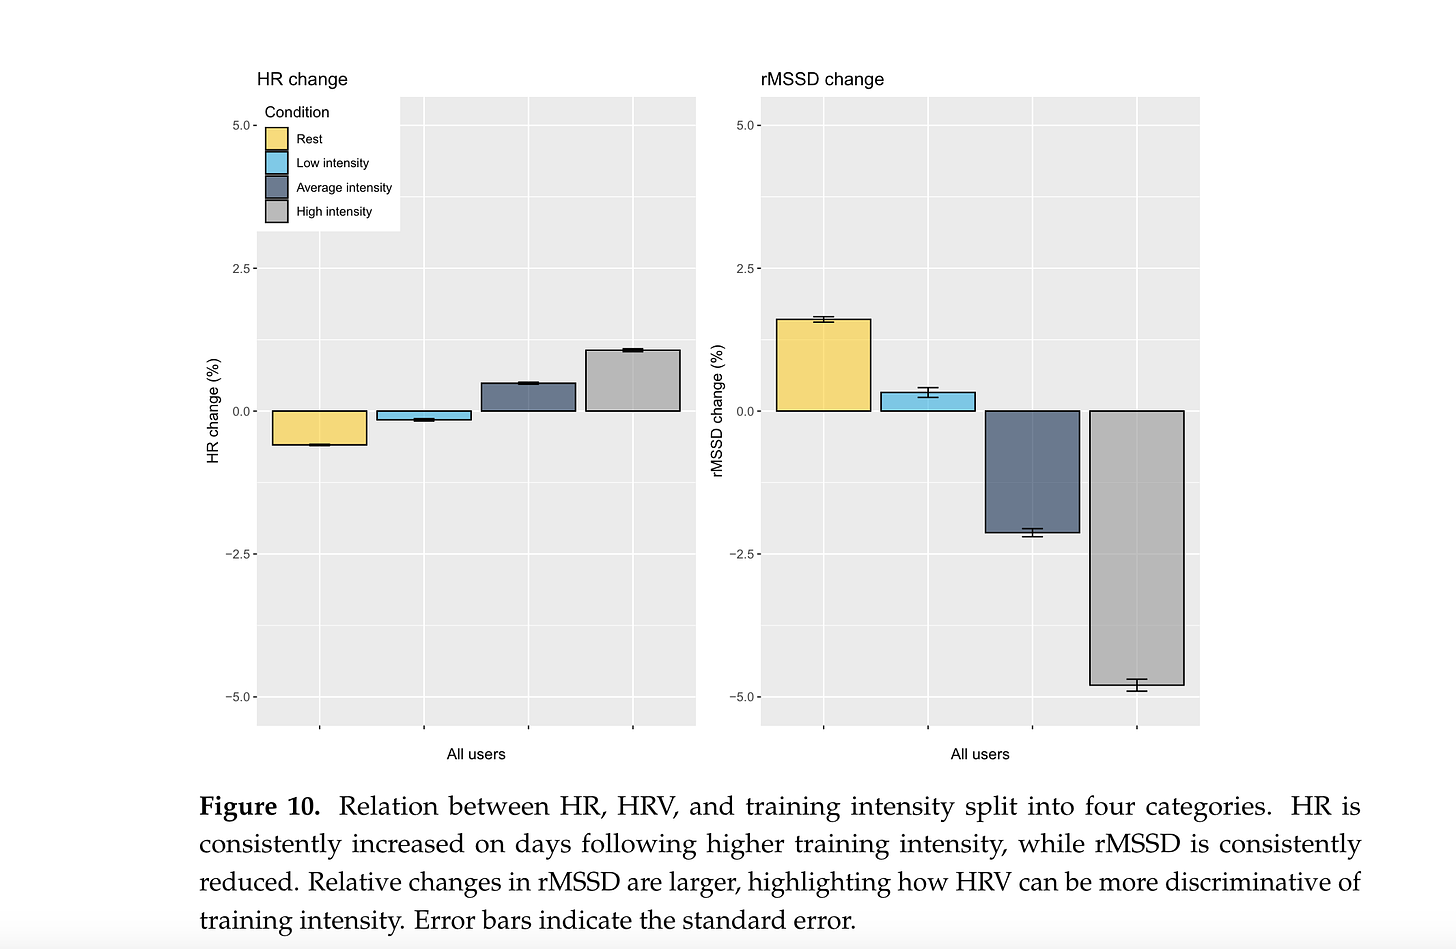
Intensity is the main parameter behind training-related changes in HRV, not volume (something I discuss here), and as such, it is likely to see suppressions in HRV after high-intensity days, as opposed to longer or easier days.
However, the change in heart rate is often not as marked, as shown also at the population level in our paper:
Why do we see these differences in heart rate and HRV?
The heart has its own pacemaker, meaning that there’s a spot (called sinoatrial node) that generates electric potentials that initiate contractions, resulting in heartbeats. If you had no other mechanism to modulate heart rhythm, our heart would beat at approximately 100 beats per minute (bpm), due to this pacemaker. This intrinsic firing rate is rather constant (hence ~no variability or HRV is present in this state).
On top of this basic mechanism, the heart is innervated by the autonomic nervous system. If you are not new to HRV, you probably heard about the main two branches of the autonomic nervous system: the sympathetic and parasympathetic nervous systems. At this point, you probably heard also that the sympathetic nervous system is responsible for stimulating the body’s fight or flight response (when we need action, resulting in increased heart rate and reduced HRV), while the parasympathetic nervous system is mainly responsible for the body’s resting functions (resulting in reduced HR and increased HRV).
This is all true, but we need to remember our context here: measuring physiology at rest. At rest, the body is predominantly parasympathetic. This means that what we measure and quantify is almost entirely parasympathetic activity.
The main neurotransmitter of the parasympathetic system is acetylcholine, while the sympathetic system relies mostly on norepinephrine. Thus, when acetylcholine is released, it binds to receptors near the sinoatrial node, and slows down heart rate. This process is pretty quick, with latencies in the order of milliseconds, which means that the parasympathetic system can slow down heart rate almost instantaneously, effectively delaying the next heartbeat, and therefore increasing HRV (bear with me, almost there).
Based on the above, we could for example speculate that parasympathetic activity is already entirely reflected in heart rate. This is not the case because the parasympathetic system doesn’t work like a faucet. The parasympathetic system is not on or off, but acetylcholine release and therefore the slowing down of heart rate happens synchronously during respiration. In particular, during expiration vagal activity is higher, leading to a slowing down of heart rate that impacts HRV, but not necessarily average heart rate.
Both your heart rate (number of beats) and your HRV (variations in timing between consecutive beats) are modulated by the autonomic nervous system in response to stress. However:
The vagus nerve activity on heart rhythm is quick and therefore captured by high-frequency HRV changes. In a matter of milliseconds, heart rate is slowed down. On the contrary, it takes several seconds for sympathetic activity to impact heart rhythm.
Vagal activity depends on breathing, with increased firing during expiration, and ~no firing during inspiration. This firing pattern originates in the brain and causes increased HRV, but are not captured by heart rate alone. This is a key peculiarity of HRV.
Hence, beat-to-beat variability at rest is always influenced by parasympathetic activity during each breathing cycle. Thus, HRV is more sensitive to parasympathetic activity than heart rate alone.
I believe this is the main reason why it is useful to track HRV, as a more sensitive marker of the stress response. In my data above, which I used as an example, we can see how heart rate remains always within my normal range, despite suppressions in HRV that I could easily link to physical and psychological stressors in the past few weeks.
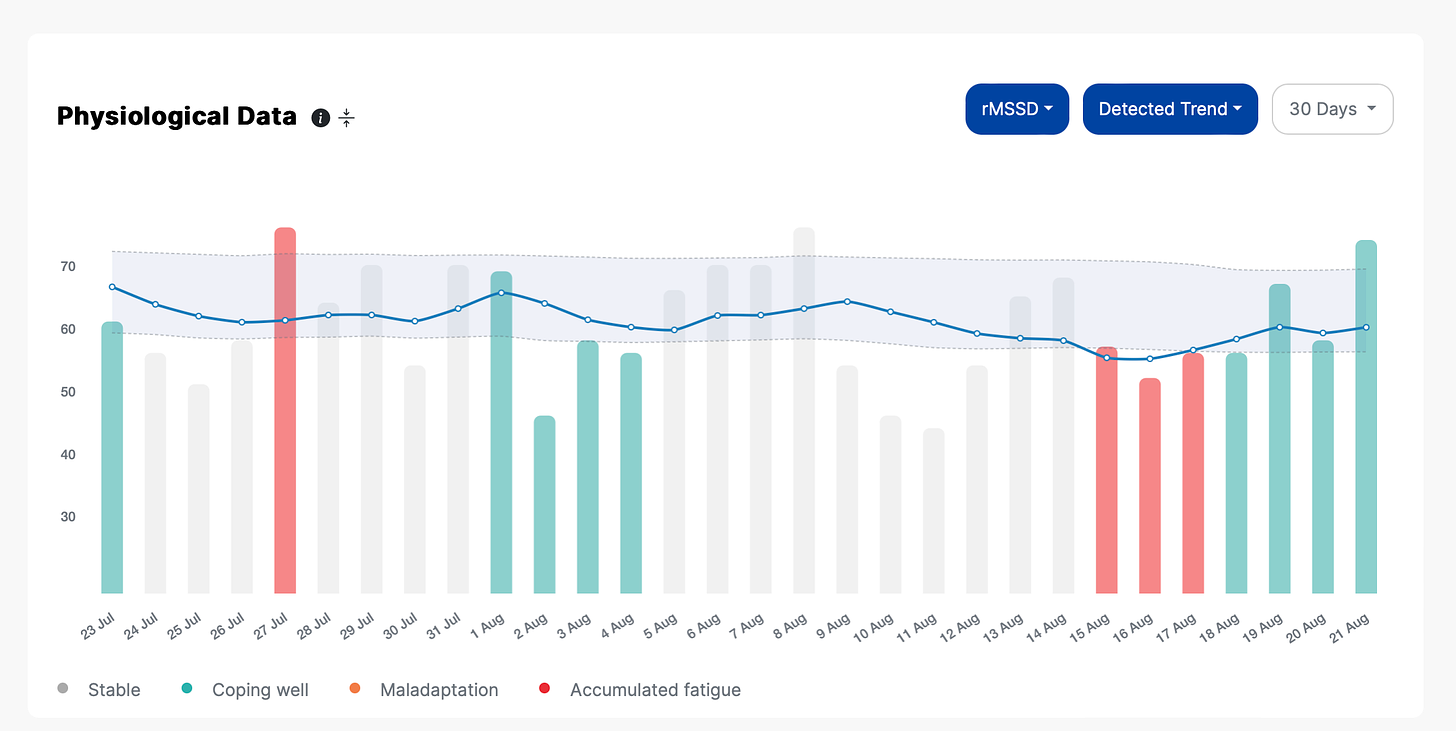
In the HRV4Training Pro screens below, both heart rate and HRV are used to estimate your current state, looking at longer-term trends in these parameters as well as the coefficient of variation. In particular, my data right now shows accumulated fatigue, resulting from a reduction in HRV, with stable or even suppressed heart rate, and increased coefficient of variation (even though this is deemed trivial, and therefore irrelevant to the estimate).
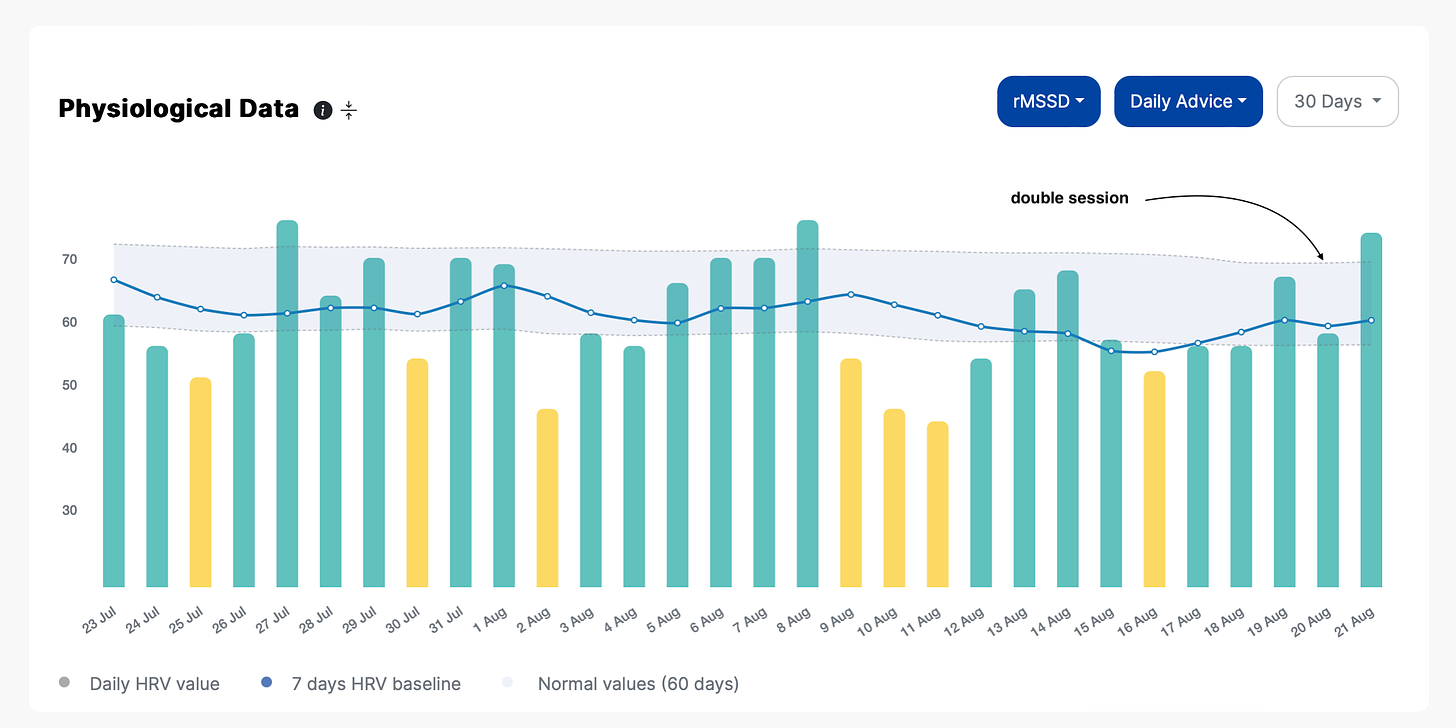
Here is data collected a few days later, after another back-to-back high-intensity session, this time of the same ‘dose’ as the last one, meaning about 24 minutes of work for both the run (August 19th) and the ride (August 20th), which finally resulted in a good response, and stable HRV:
and the resulting detected trend:
It took me four back-to-back sessions, done consistently weekly, and increasing a bit the volume each time, to get to a positive response. The body adapts, and our response changes.
A note here on scores in wearables, in case you are trying to look for these patterns in your device: if you look at your data confounded by behavior, e.g. a recovery or readiness score that includes activity levels and / or sleep time, you are not looking at your body’s response (!) and cannot learn about how you are adapting to a given stimulus (maybe your physiology is normal, but you slept a bit less - an irrelevant factor that would however drive the readiness / recovery score to a lower value). The only way to analyze our response and learn from it is to look at the physiology alone, with respect to our normal range, without penalizing it based on behavioral factors. Behavior is key context, but if you want to understand your response, then what you want to look at is the physiology.
To conclude, both heart rate and HRV can be useful in tracking individual responses to stressors, even though HRV tends to be more sensitive to stress, especially if we use good protocols (e.g. measuring while sitting up, first thing in the morning). The data above also helps serve another purpose, i.e. showing how heart rate and HRV are clearly not the same thing, as they are changing in similar ways during the past few days (both are suppressed, as opposed to the lower HRV and higher heart rate response that we might normally expect). A suppression in heart rate can be a sign of fatigue, just like a suppression in HRV, and looking at both parameters tends to be more insightful than using only one of the two.
I hope this was informative, all the best for your training!
Marco holds a PhD cum laude in applied machine learning, a M.Sc. cum laude in computer science engineering, and a M.Sc. cum laude in human movement sciences and high-performance coaching.
He has published more than 50 papers and patents at the intersection between physiology, health, technology, and human performance.
He is co-founder of HRV4Training, advisor at Oura, guest lecturer at VU Amsterdam, and editor for IEEE Pervasive Computing Magazine. He loves running.
Social:
Twitter: @altini_marco (currently inactive).
Personal Substack.




Hi Marco. Thank you for a great product and your continued writing on the subject.
I take a 1 min reading using iPhone at the same time every morning - occasionally I will redo the test if I see a HRV below baseline as I am trying to use it as a major determinant of training that day. The result is always different (to be expected?) but my concern is when the results flick between below and within baseline, like today (HRV 6.6 below, then 7.0 within).
Any advice? 🙏