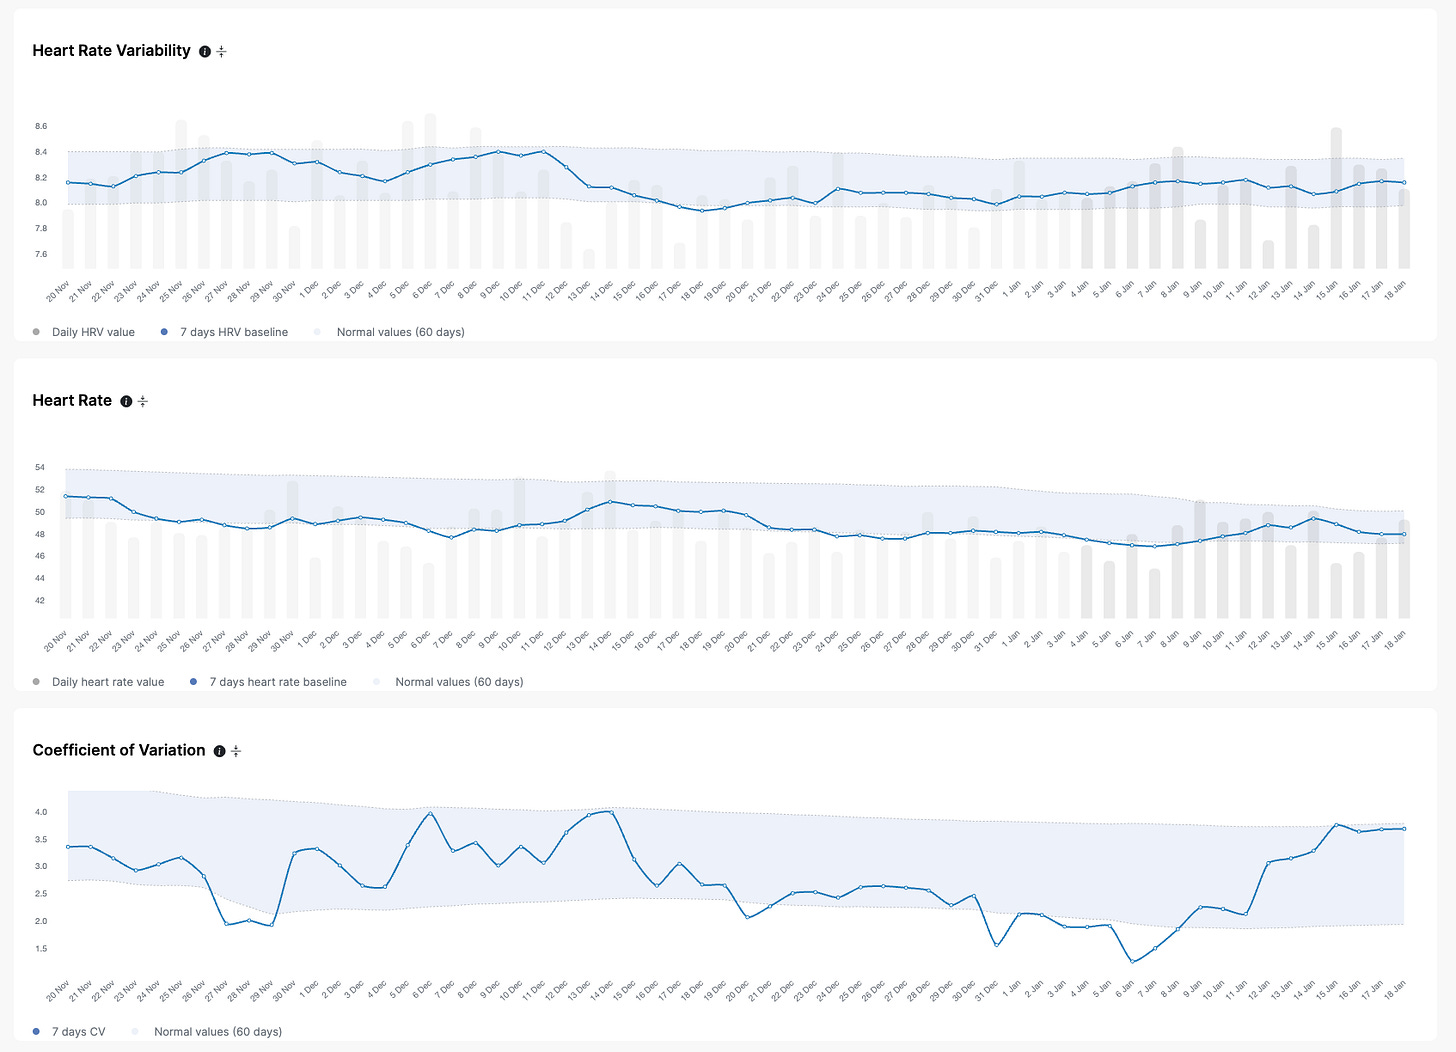
One of the most interesting ways to analyze heart rate variability (HRV) data is to look at the amount of day-to-day variability in your HRV scores. That's what we call the Coefficient of Variation.
The HRV Coefficient of Variation is different from your baseline, which is simply the average of your scores over a week. Analyzing both the baseline rMSSD value and its variation can provide more insights compared to looking at the baseline only. In simple terms, the Coefficient of Variation HRV reflects how much your scores jump around on a day-to-day basis.
Lots of jumping around = high Coefficient of Variation
HRV Stable values = low Coefficient of Variation HRV
Why do we care?
Normally, the most important aspect to analyze is how your baseline is going with respect to your normal values. A baseline within normal values shows a stable physiological condition and good adaptation.
However, the amount of day-to-day variability (the Coefficient of Variation), combined with baseline changes with respect to normal values, can provide additional insights on adaptation to training and other stressors and the HRV Coefficient of Variation can flag issues in response to stress, before a baseline reduction. Quoting Andrew Flatt ”the preservation of autonomic activity and less fluctuations (reduced CV HRV) seem to reflect a positive coping response ... In fact, individuals who demonstrated the lowest CV HRV during increased load showed the most favorable changes in performance".
When both heart rate and HRV are stable, the coefficient of variation can be particularly useful. In particular, a reduction in the coefficient of variation has been associated with an increased risk of non-functional overreaching [1]. This makes sense since less variation might mean that there is more stress or that the system is unable to respond or bounce back. However, there is some controversy on this point since other authors interpret a reduction in HRV Coefficient of Variation as a measure of better adaptation [2]. This also makes sense since we expect more day-to-day changes if we are not coping very well with the training and therefore HRV jumps around more, showing difficulty in maintaining homeostasis (e.g. when we start a new training phase with more high-intensity work). A multiparameter approach allows you to make sense of both trends, as a lower coefficient of variation becomes problematic only when HRV is also suppressed.
[1] Plews, D. J., Laursen, P. B., Kilding, A. E., & Buchheit, M. (2012). Heart rate variability in elite triathletes, is variation in variability the key to effective training? A case comparison. European journal of applied physiology, 112(11), 3729–3741.
[2] Andrew Flatt blog. http://hrvtraining.com/2015/05/19/hrv-stress-and-training-adaptation/
How do you use the CV HRV?
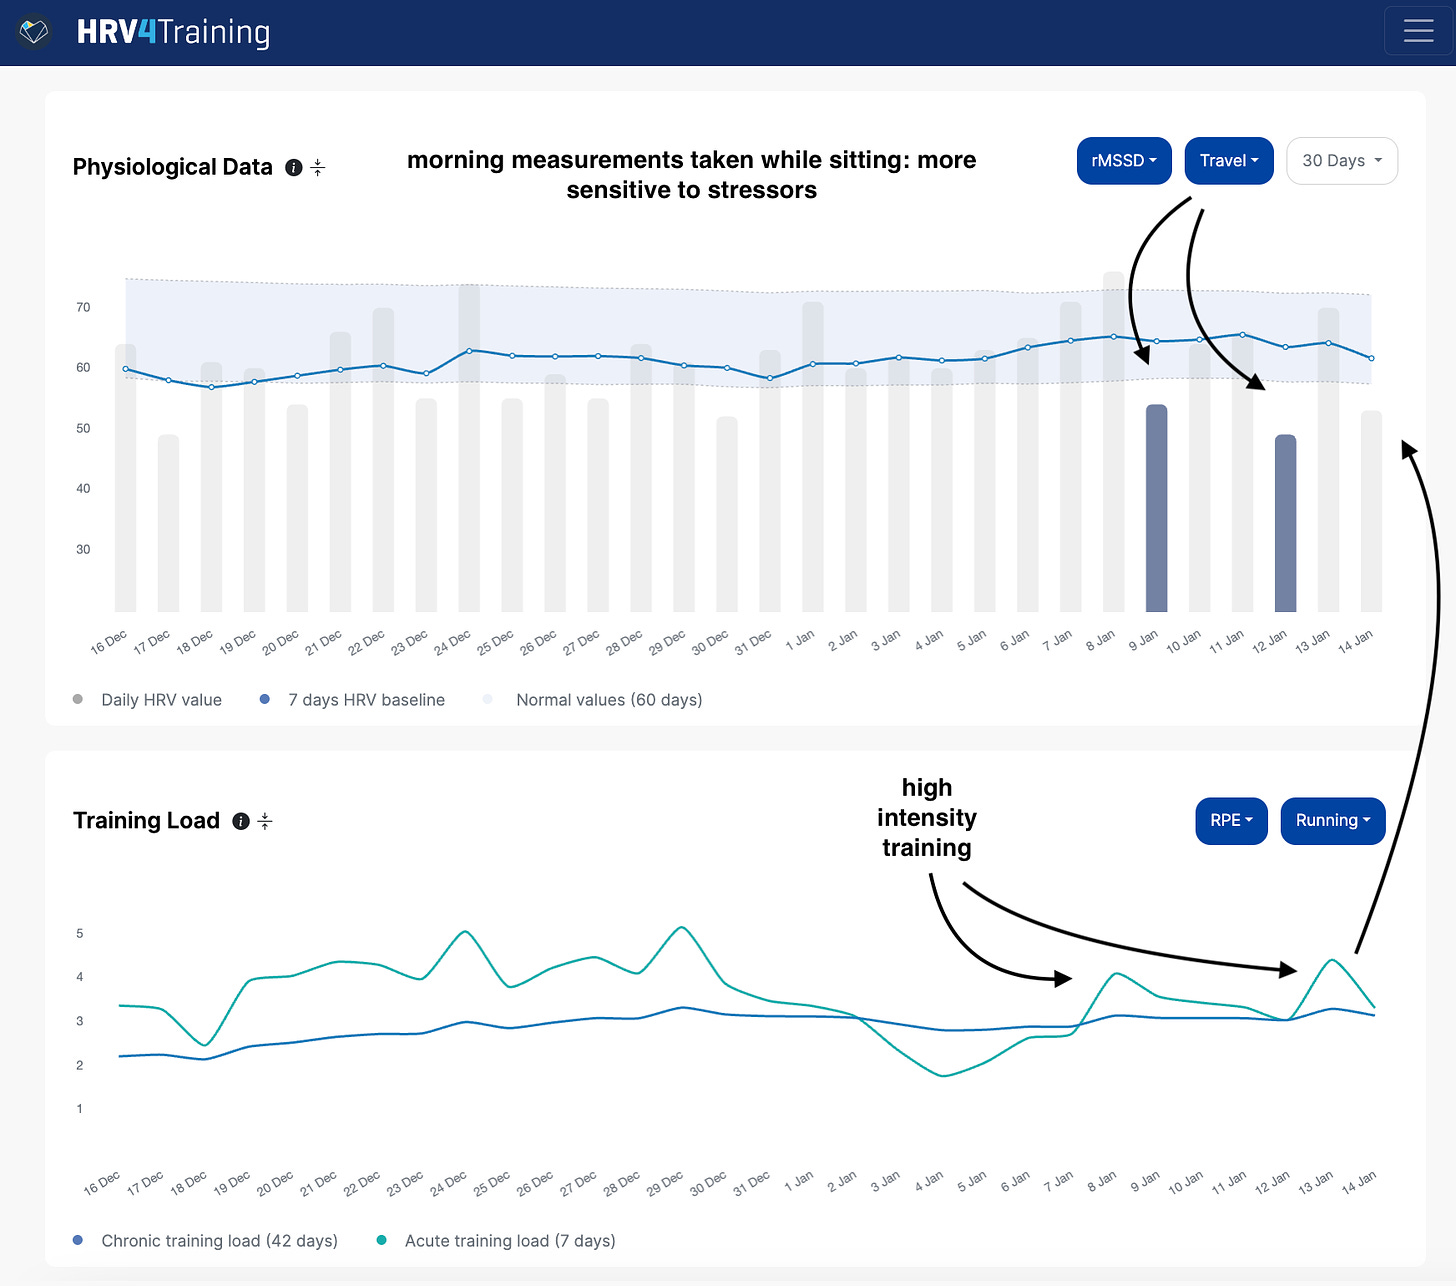
Let's look at one example. Below is my data, morning HRV taken while sitting up, which is my recommended protocol for endurance athletes. As discussed a few times, this is a protocol that makes it easier to capture your stress response we can indeed see that both travel (color-coded) and high-intensity training (I used RPE as a simple marker of intensity) have an impact, despite baseline HRV being still within the normal range.
We have three suppressions below the normal range in the last week. This added variability due to suppressions and quick rebounds within normal range, is what is captured by the Coefficient of Variation, another important metric to determine your stress response, which you can find in HRV4Training. As mentioned in the previous section, a higher coefficient of variation is often associated with a less-than-ideal response.
In HRV4Training Pro you can also color-code the data using the coefficient of variation, which shows an increase during this phase:
There's more in the data than just averages and normal ranges, the variability in the data itself, over a few days (i.e. the Coefficient of Variation), can provide additional insights.
The data in this case allows us to understand that we are in a situation where we are still able to cope with the stressors imposed on the system (i.e. we bounce back right after a suppression), but that we are probably at our limit (frequent suppressions, increased Coefficient of Variation).
This could be a good moment to make some small adjustments to either reduce stressors or prioritize recovery.
Below is the resting physiology view in HRV4Training Pro, which includes your HRV and heart rate with respect to their normal ranges, and the coefficient of variation:

Short recap
Ideally, in the medium term, these are good trends we should hope to see if we are responding well to the various stressors in our lives:
HRV stable and within normal range or slightly increasing.
Stable or reducing HRV Coefficient of Variation.
Pay attention to deviations from these trends to spot potential issues in advance, which is easy to do in the HRV4Training app and web platform.
You can learn more about trends in resting physiology, here. I hope you have found this blog informative!
Marco holds a PhD cum laude in applied machine learning, a M.Sc. cum laude in computer science engineering, and a M.Sc. cum laude in human movement sciences and high-performance coaching.
He has published more than 50 papers and patents at the intersection between physiology, health, technology, and human performance.
He is co-founder of HRV4Training, advisor at Oura, guest lecturer at VU Amsterdam, and editor for IEEE Pervasive Computing Magazine. He loves running.
Social:
Twitter: @altini_marco.
Personal Substack.


