Lab testing 2023
Comparison with 2022
In this blog I compare my lab tests from 2022 and 2023. I tested both times with the same protocol, at ConTest in Amsterdam (thanks Melvin!).
TL; DR
higher VO2max (59.8 ml/min/kg → 62.1 ml/min/kg)
lactate curve shifted to the right (LT1 1 km/h faster)
lower heart rate (8-10 bpm at any speed)
lower breathing rate near the first threshold and above
lower cost of running / higher economy (2681 ml/min → 2426 ml/min at 10.5 km/h)
Training background
In the past 12 months, I ran about 5,666 km or 570h hours (my highest yearly volume). This year I’ll be 39 years old. I am running since 2009, and I have been building very gradually over the years. For more details about my training during this past year, check out this blog post, and also this one covering the buildup for a 10km race after running a marathon PR.
In short, 6 runs per week (Mondays always off), lots of easy volume, block periodization, hard sessions as frequently as I can handle them (i.e. about one every 5 days, or 3 every 2 weeks), and specificity as I approach a race. Goal events are marathons and a 100 km ultra, hence mostly focusing on longer distances, despite unfortunate genetics.
I had planned to test a few weeks ago but had to postpone due to a hamstring strain that I had during a recent race, and which seems (almost) fully recovered.
Protocol
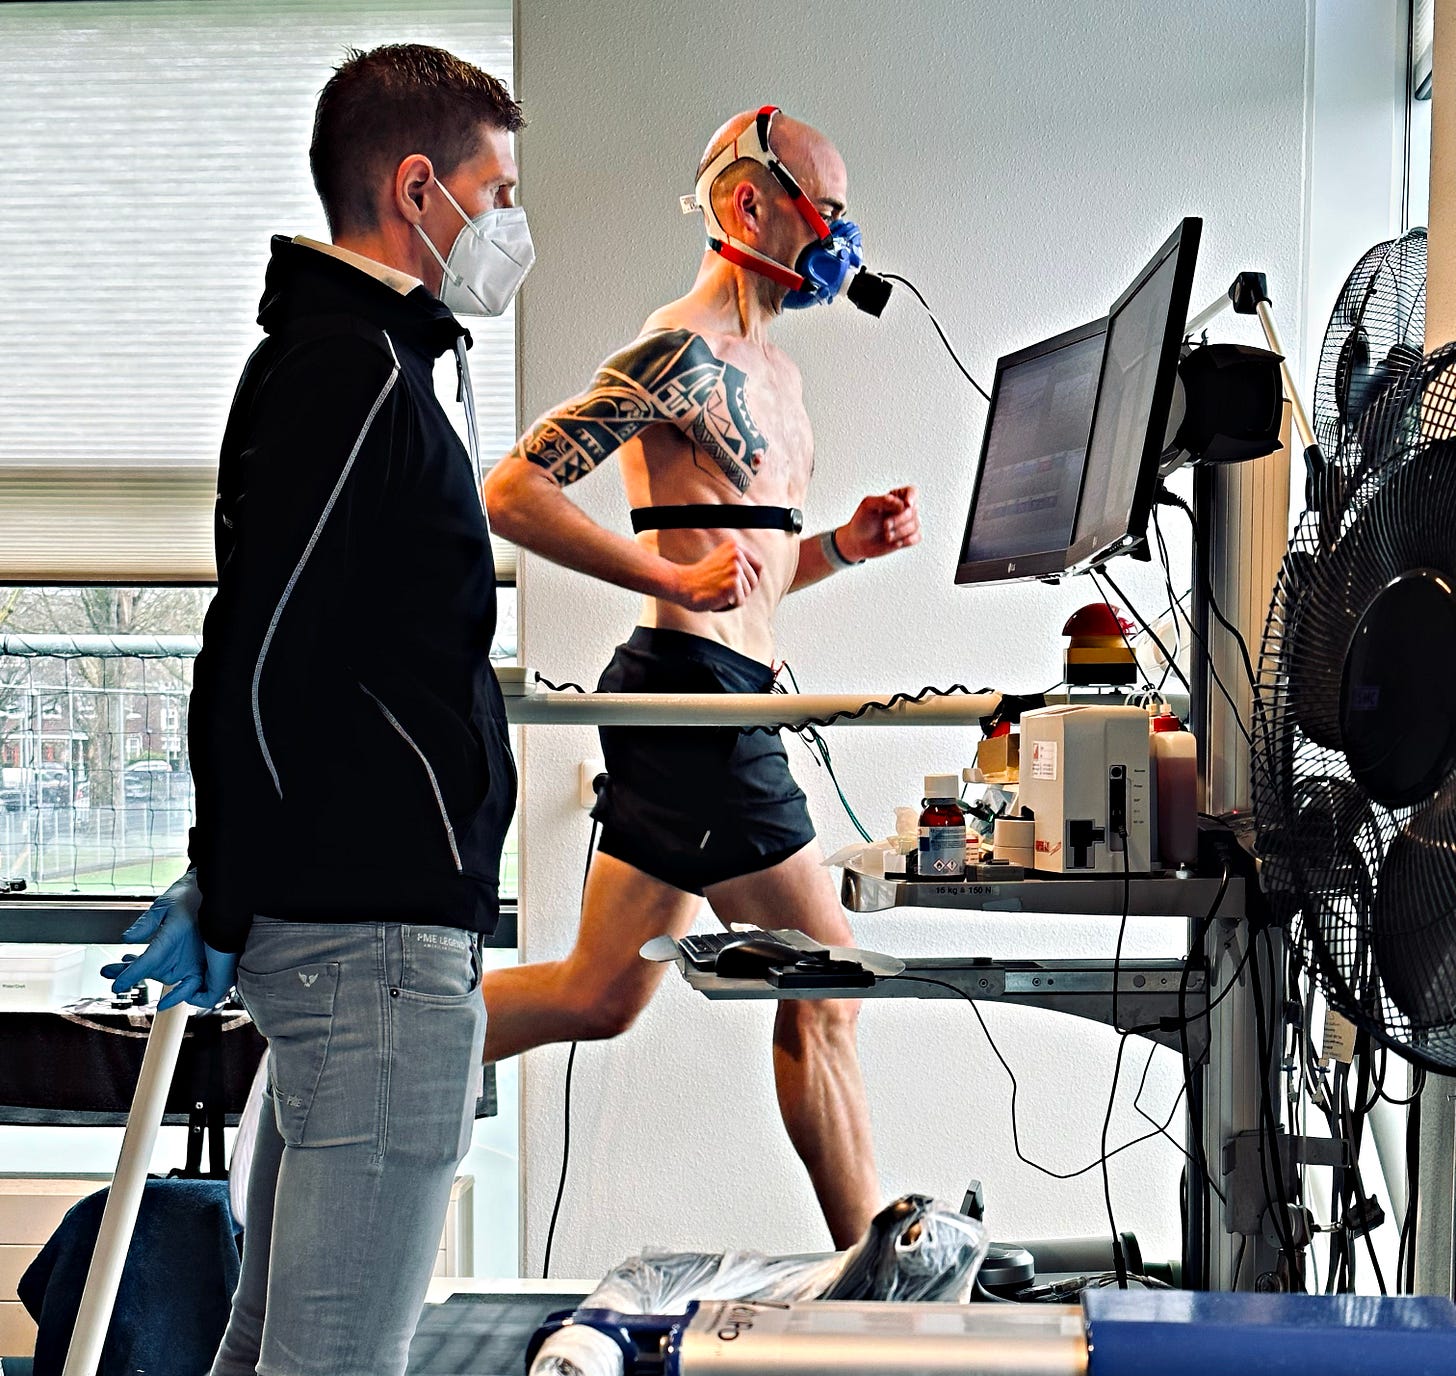
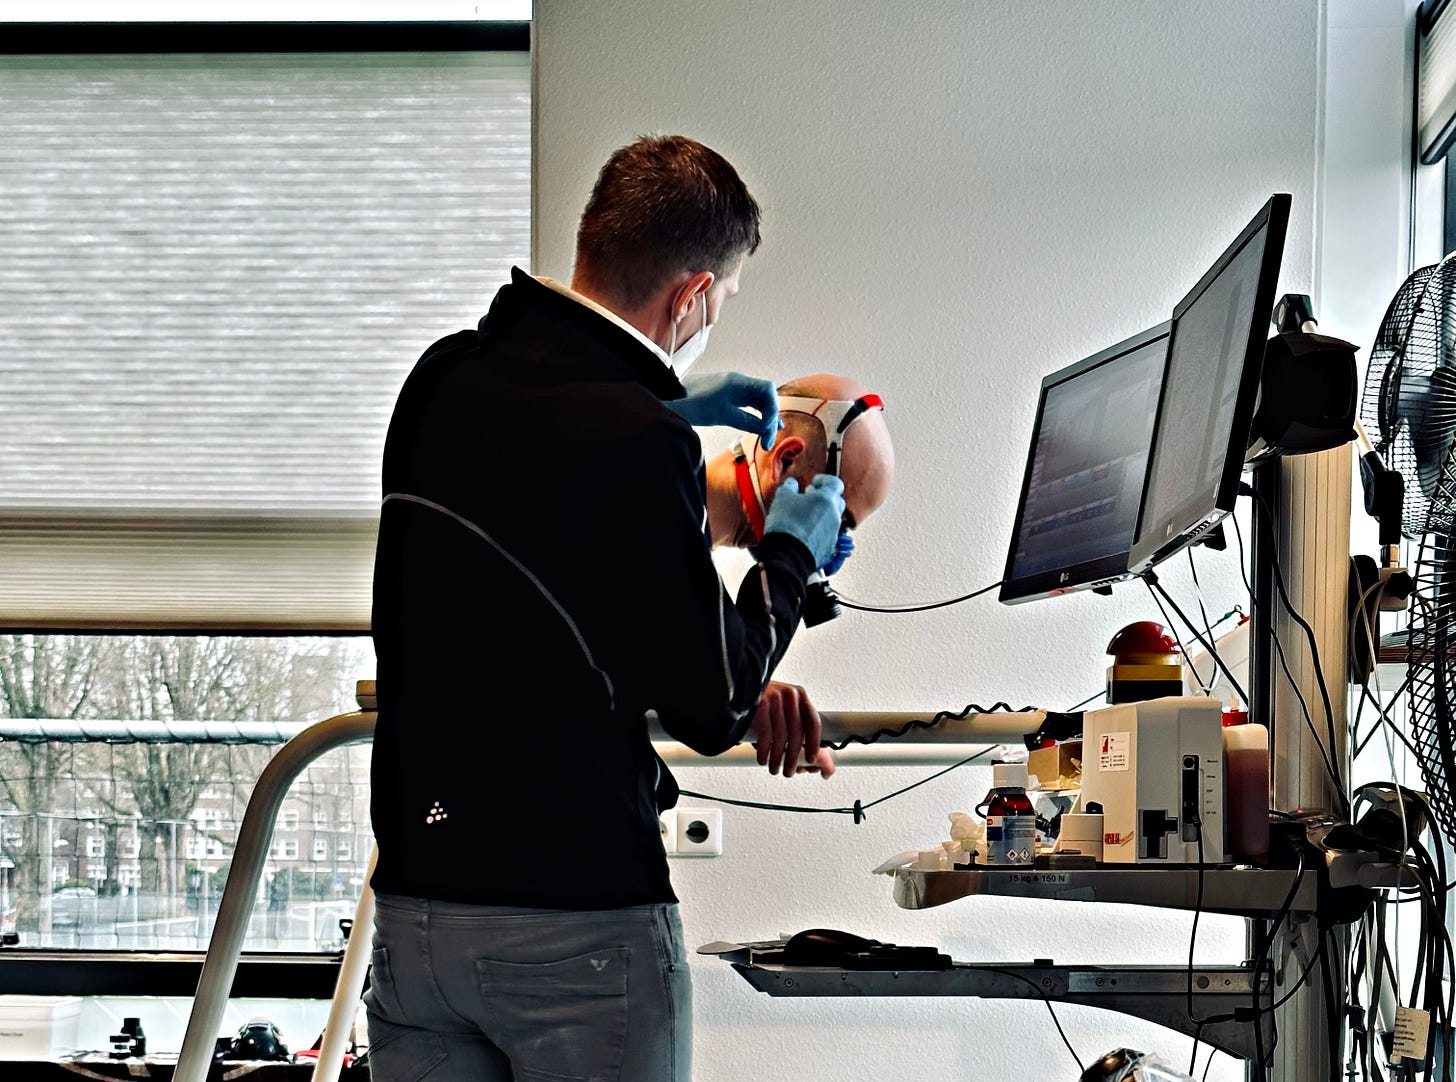
The protocol used is a typical incremental exercise test for VO2max, where speed is increased by 1 km/h every 3 minutes.
This is not ideal for lactate, but the protocol is the same every year, and therefore we can still compare progress (or lack thereof). Just keep in mind that if we were do derive thresholds, they would likely be optimistic (we could shift the curve 1 km/h back and have a somewhat pessimistic view, the truth probably lies somewhere in between).
The data
Below I cover the following:
weight
VO2max
lactate
heart rate
breathing rate
running economy
Weight
Last year I was 72.6 kg on the day of the test, while this year I was 66.7, a large difference (5.9 kg or 13 pounds).
VO2 max
In terms of VO2 max, in absolute numbers, last year I stopped the test at 4345 ml/min of VO2, while this year at 4143 ml/min. When we normalized it by body weight, we have that last year’s VO2 max was 59.8 ml/min/kg, while this year is 62.1 ml/min/kg.
I don’t have breath-by-breath data yet, hence here I can only plot the last value at each step of the protocol (which is why you don’t see a plateau for 2022, while it is quite visible for this year’s data). Last year I completed only 2 minutes out of the 3 for the 16.5 km/h, while this year I completed the entire 17.5 km/h step (hence all the data is present).
We can also look at fractional utilization. For example, considering that I just ran a half marathon at 3’52”/km (until the last 200m, when I got injured), this means that half marathon pace is 15.5 km/h, and therefore my fractional utilization, based on my max, was 89%. For a 3-hour marathon, I need to be at about 77-78% of my VO2 max, according to this data. Last year’s data shows similar numbers but shifted by 1 km/h. Good progress.
Lactate
Below is the lactate curve. We can spot a couple of things. First, a slightly higher baseline value (probably quite irrelevant as it might be within measurement error). Secondly, lactate stays flat for the first three stages, with no change at all. Third, the whole curve is shifted to the right, with an extra data point as I could reach one step further in the protocol.
Keep in mind that these are short steps for lactate, as there are trade-offs in doing both VO2 max and lactate in a single test. However, the comparison shows clear progress also here, with the first inflection point now at about 13.5 km/h.
Below is the same data where I annotated the first rise in lactate, or the aerobic threshold (LT1). I take the first raise in lactate above baseline as LT1.
Heart rate
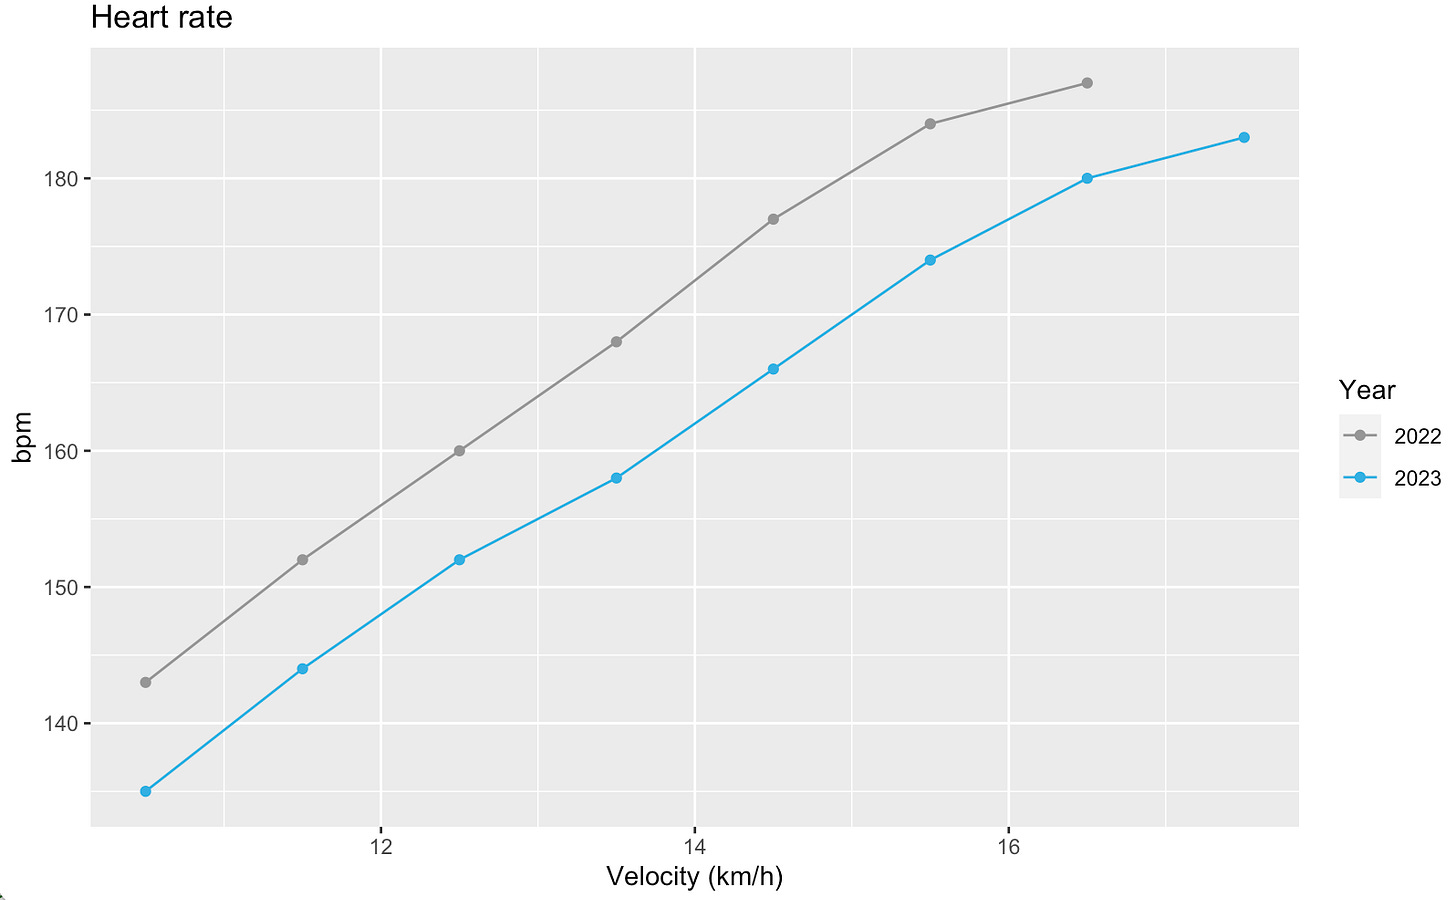
Last year my heart rate was quite high at the beginning, maybe a bit too much excitement for the test. Regardless of the reason, this is always a clear signal that heart rate data collected in the lab at sub-maximal intensities should be taken with a grain of salt. Today, heart rate was still higher than it would be in regular training at the same speeds (for the slow speeds), hence we can probably compare the two years meaningfully.
In heart rate data, we have almost a full shift to the right, showing how heart rate while running 1 km/h faster is the same as last year’s when running 1 km/h slower. Given that now I am more fit, and able to train harder more often, we can also see a suppression in maximal heart rate, which does not reach my usual 187 bpm, but stops at 183 bpm, a reduction of 4 bpm.
Not sure honestly if we can read anything in the deflection points here, but we do seem to have one this year at 13.5 km/h, which is in line with what we see in lactate. This is probably not far from my first threshold.
Breathing rate
Below is my breathing rate, which shows a similar trend at the beginning, then de-couples around my first threshold, and reaches the same max reached last year (58 breaths/minute).
I am not an expert on this, but I find the data below extremely interesting, as it seems to capture better than other signals the shift between easy and not easy (e.g. what we could call the aerobic threshold).
Economy
I am always quite interested in the energy cost of running, as mine has always been disproportionally high. I think this is the main factor that holds me back in the events I actually target (marathons or longer).
I shared earlier how my economy is the lowest I have ever measured (high energy expenditure at a given external load, or pace in this case):
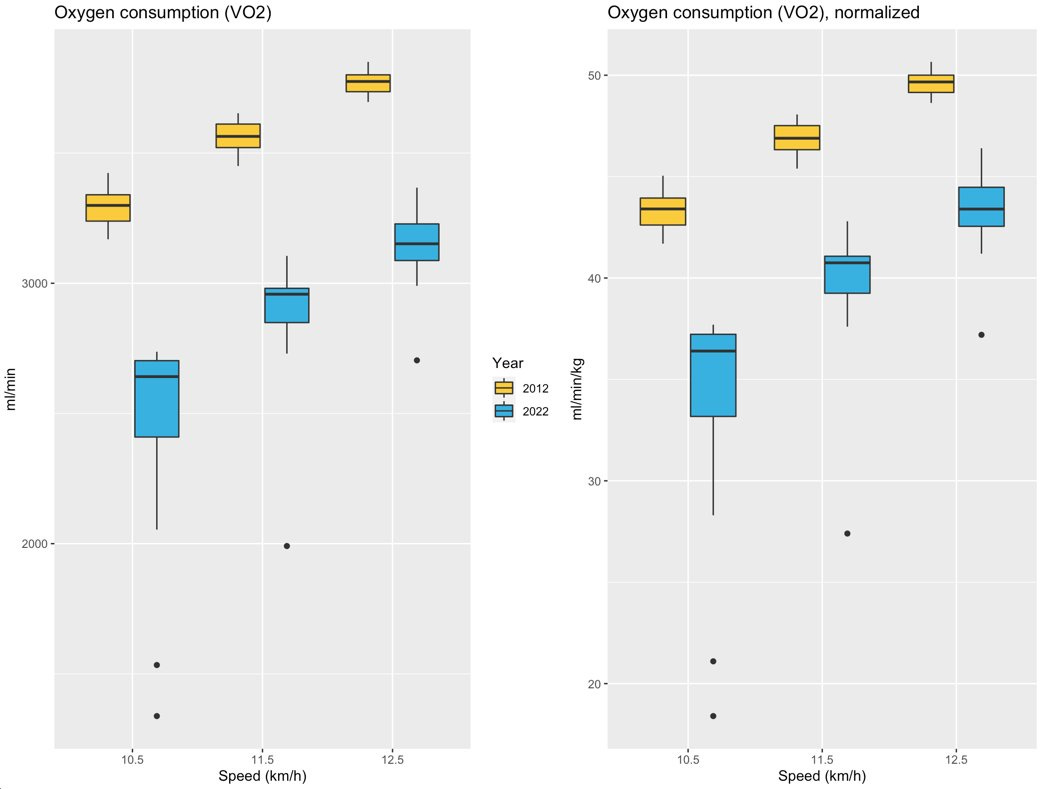
but also how large improvements can occur over a decade of running, as shown using last year’s data:
In 2022 the cost of running at 10.5 km/h was 2681 ml/min (or 36.9 ml/min/kg), which was already a large improvement from 2012, where I was around 3300 ml/min (or 44 ml/min/kg).
This year, the cost of running at 10.5 km/h is further reduced, as shown below. Another step in the right direction, brought by 570 hours of running in 12 months.
Performance
In the past 6 months, I ran PRs in the 10km, half marathon, and full marathon. Hence, I expected to see some improvements.
The data to me is particularly interesting in terms of the actual cost of running, my economy, and what this means for the long events I am targeting in the next months (marathon to 100 km).
As I get closer to my ceiling, I am also curious to see if there will be changes next year. VO2 max might be stable, considering also that weight will not further reduce, but running economy might keep improving for a few more years. Time will tell.
In the meantime, I still have 2 minutes and 24 seconds to chase!
Thank you for reading
Marco holds a PhD cum laude in applied machine learning, a M.Sc. cum laude in computer science engineering, and a M.Sc. cum laude in human movement sciences and high-performance coaching.
He has published more than 50 papers and patents at the intersection between physiology, health, technology, and human performance.
He is co-founder of HRV4Training, advisor at Oura, guest lecturer at VU Amsterdam, and editor for IEEE Pervasive Computing Magazine. He loves running.
Social:








Hi Marco !
Is breathing tracking in the lab test the same as your Garmin watch ?
Thank's
Hi Marco,
inspired by your post I tried to look at my HR/Speed chart for some comparable assessment runs to see if and how my curve progressed over time, but my data definitely doesn't look as tidy as yours.
Were the charts provided by the lab or you created them yourself (they look like made with R)? In this case, may I ask you about your methodology?